


Signal of the week: Bitcoin’s Coinday NVT and RVT ratios — which measure whether the price has outrun actual network usage — hit their highest readings since December 2023. Historically, similar surges preceded a major slow down in the uptrend, or a transition to a bearish trend.
Short and long-term holders are both in profit and selling pressure significantly decreased. However, several indicators outside of holder behavior are starting to flash warning signs — and historically, this tends to happen just before the easiest phase of a rally comes to an end.
About the Bitcoin Impact Index
The Bitcoin Impact Index measures which groups of Bitcoin holders are under financial stress, how severe that stress is, and whether it’s severe enough to shake confidence in the market’s direction. It combines on-chain holder behaviour, ETF and derivatives activity, and exchange-level liquidity flows into a single weekly score between 0 and 100. Unlike sentiment indicators, it deliberately excludes social media and volume data to focus on what participants are doing rather than what they are saying.
Score bands:
- Normal Rotation (0–24) — routine profit-taking, no structural shift
- Elevated Repositioning (25–49) — specific groups shifting positions, pressure uneven across the market
- High Impact (50–74) — broad stress across multiple holder groups and institutional flows simultaneously
- Critical Impact (75–100) — full capitulation: LTH losses, large ETF outflows, major liquidations, and heavy exchange inflows at once
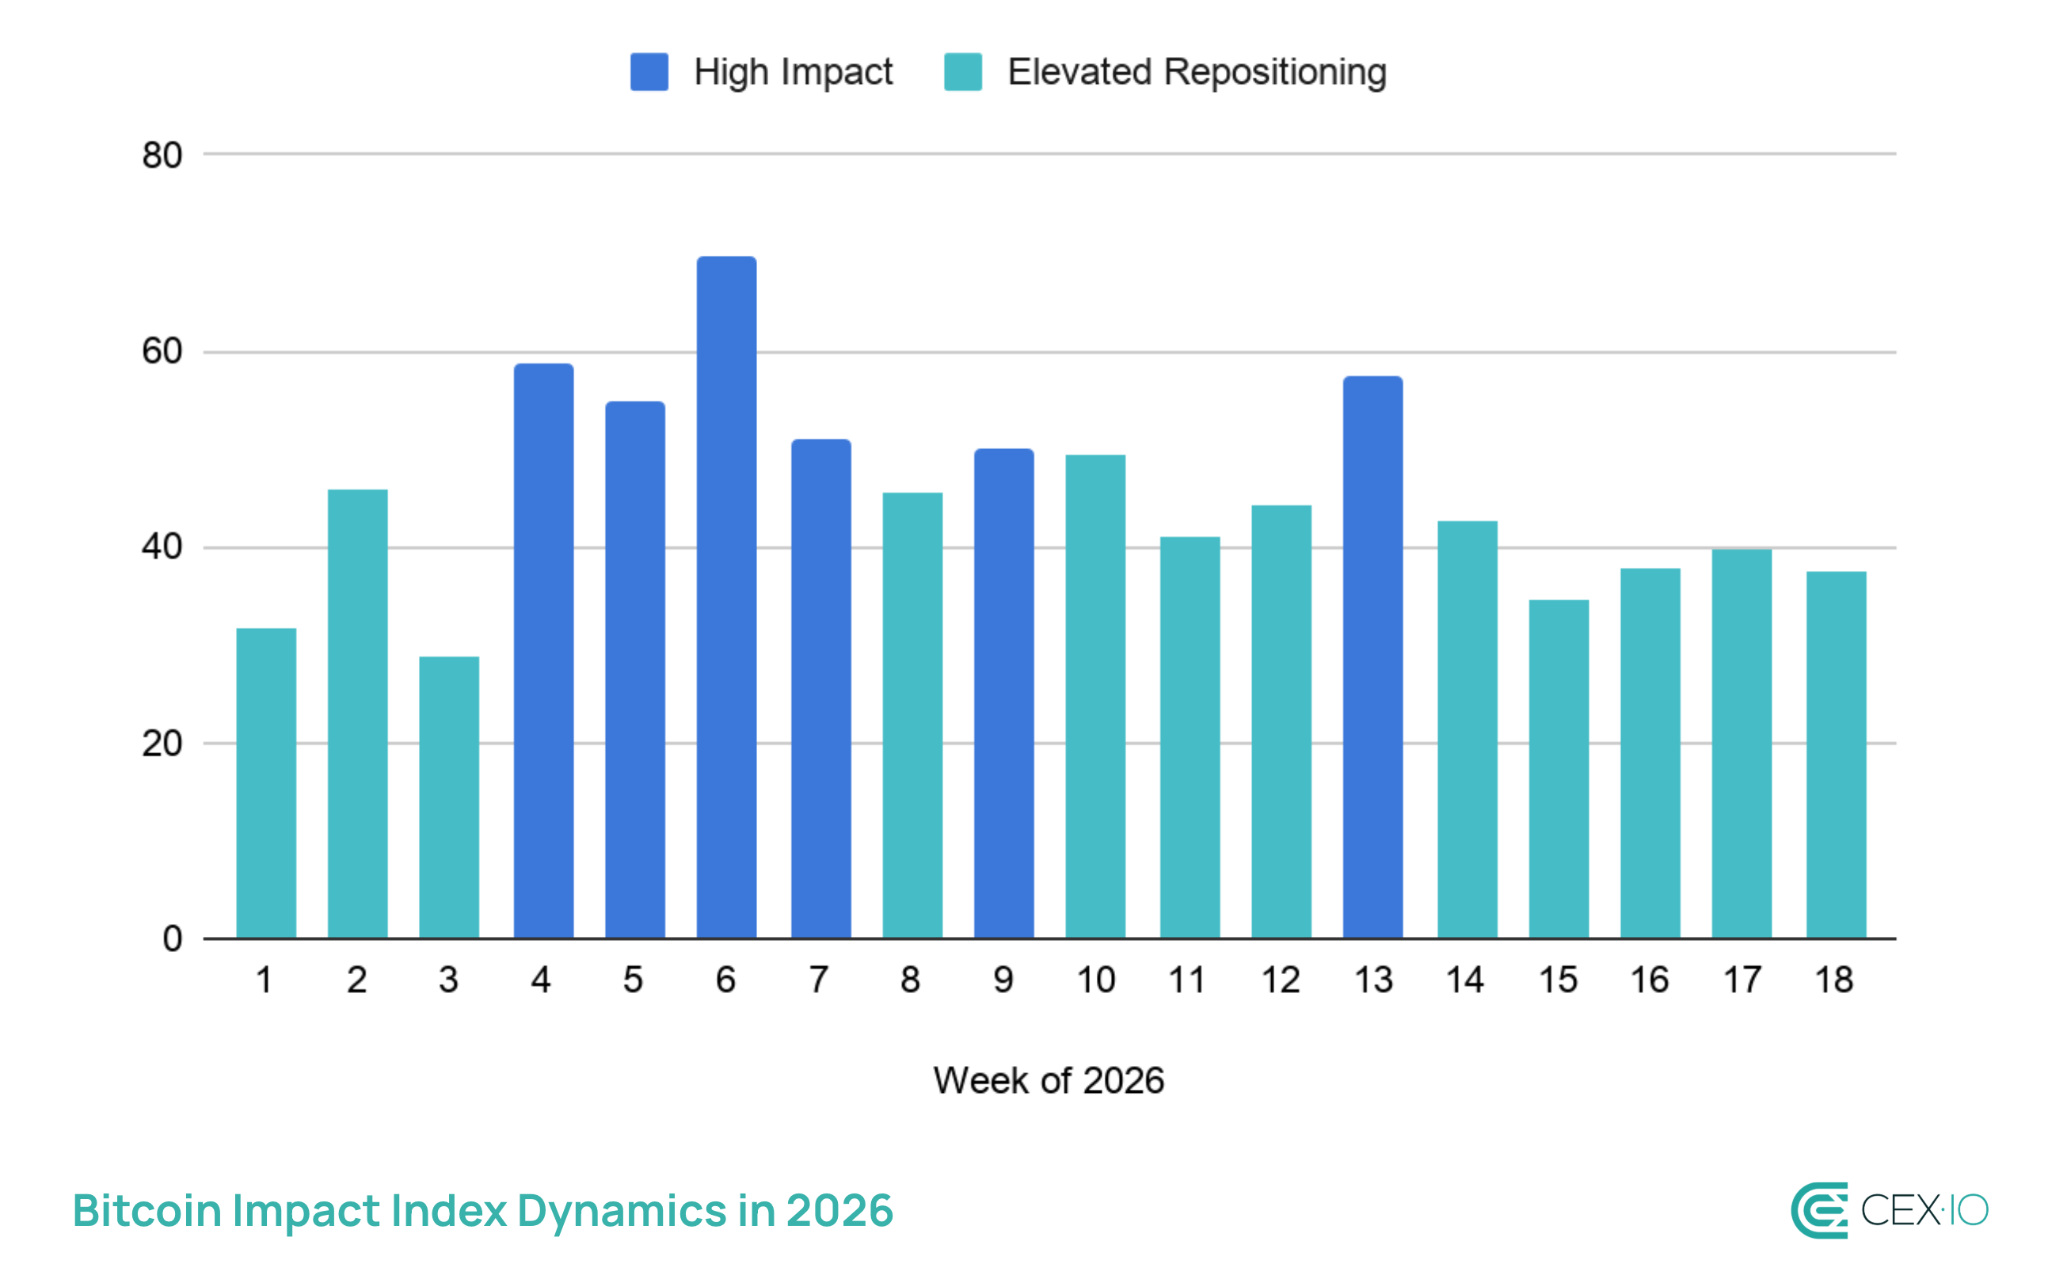
Week 18 (April 27 – May 3): BII 37.6 — Elevated Repositioning
The index value barely moved this week, but two components shifted sharply in opposite directions — holder stress dropped to near its lowest point of the year, while liquidity signals deteriorated meaningfully.
Positive signals: holders are the least stressed they have been all year
While Bitcoin was testing $80,000, both short and long-term holders have primarily seen positive P/L ratios, with short-term holders profitability hovering at 2026 highs. Long-term SOPR ticked up further to 1.12, meaning the veterans are also selling at a healthy profit margin. This suggests that neither group is under significant pressure.
Negative signals: multiple warning signs appeared at once
Bitcoin’s Coinday NVT and RVT ratios, which measure how expensive Bitcoin looks relative to the actual economic activity happening on its network, for both short- and long-term holders surged to the highest levels since December 2023. Think of it like a price-to-earnings ratio for Bitcoin: when the number is high, it means the price has run ahead of the underlying usage. Historically, when these metrics rapidly go up, this preceded a slowdown of Bitcoin’s upward momentum, potentially transitioning to a bearish trend.
Alongside that, stablecoin flows to exchanges swung from +$117M daily average last week to -$398M this week — the largest single-week reversal since January. That means fresh capital that had been arriving to buy is now leaving.
At the same time, ETF inflows dropped to $154M, the smallest weekly inflow since early April. Considering that recent ETF net inflows have been broadly similar to the increase in CME open interest, a meaningful share of this demand might be tied to the cash-and-carry trade. Cash-and-carry flows are market-neutral, so they reduce how much of recent ETF demand should be viewed as outright bullish positioning.
Mixed signals: accumulation paused and more Bitcoin is arriving on exchanges
The cost of being short fell this week as funding rates moved from their extreme lows toward a less punishing level. That is partly positive — the short squeeze pressure that has been building for weeks released some steam. But funding rates remain negative, meaning shorts are still net paying to hold their positions and the bearish conviction has not fully unwound.
Long-term accumulation essentially paused after last week’s historic buying spree, as net LTH balance barely moved. That is a natural cooldown after a record run, but it removes the supply-absorption tailwind that has been a consistent positive for several weeks.
In addition, while raw exchange inflows stayed low, Bitcoin’s net exchange flow — the difference between what arrives and what leaves — hit its highest level since early February. As more BTC is arriving on exchanges, this suggests that a potential preparation for Bitcoin selling may take place.
What could happen next
The most likely near-term path is a stall. A sharper move lower becomes probable if stablecoin outflows and elevated Bitcoin exchange inflows persist into next week. To invalidate the claim, Bitcoin would need to show a sustained breakout above $80,000, potentially with rising LTH accumulation and/or positive funding rates supporting the move. Without it, a bearish move could just be delayed.
As such, it’s important to keep in mind that surging NVT/RVT ratios don’t suggest the immediate correction but rather a potential erosion of the bullish momentum. As a result, Bitcoin still could be in a bear market and the retest of lower levels, including $60,000, remains possible in the mid-ter
The web content provided by CEX.IO is for educational purposes only. The information and tools provided neither are, nor should be construed as, an offer, or a solicitation of an offer, or a recommendation, to buy, sell or hold any digital asset or to open a particular account or engage in any specific investment strategy. Digital asset markets are highly volatile and can lead to loss of funds.
The availability of the products, features, and services on the CEX.IO platform is subject to jurisdictional limitations. To understand what products and services are available in your region, please see our list of supported countries and territories. This page includes additional links to information about individual products, and their accessibility.