

Close Menu
Altcoinvest
    What's Hot

    Seeker’s euphoric rally meets holder exits – Can SKR’s momentum hold?

    August 31, 2026

    Capital B Raises €21M From Adam Back And TOBAM

    August 31, 2026

    Bitcoin Holds $78K As Strait Of Hormuz Strike Lifts Oil Above $90

    August 31, 2026
    Facebook X (Twitter) Instagram
    Altcoinvest
    • Bitcoin
    • Altcoins
    • Exchanges
    • Youtube
    • Crypto Wallets
    • Learn Crypto
    • bitcoinBitcoin(BTC)$78,399.00-0.19%
    • ethereumEthereum(ETH)$2,456.93-0.39%
    • tetherTether(USDT)$1.00-0.02%
    • binancecoinBNB(BNB)$688.24-0.96%
    • rippleXRP(XRP)$1.38-1.60%
    • usd-coinUSDC(USDC)$1.00-0.01%
    • solanaSolana(SOL)$103.47-1.85%
    • tronTRON(TRX)$0.334832-1.73%
    • Figure HelocFigure Heloc(FIGR_HELOC)$1.000.00%
    • HyperliquidHyperliquid(HYPE)$81.96-1.75%
    Altcoinvest
    Home»Bitcoin»TSLA Stock Compression Puts $390 Support in Focus
    TSLA Stock Compression Puts 0 Support in Focus
    Bitcoin

    TSLA Stock Compression Puts $390 Support in Focus

    July 14, 2026
    Share
    Facebook Twitter LinkedIn Pinterest Email

    TLDR

    • TSLA stock gained 0.45% and closed at $396.52 after failing to hold above $400.
    • The shares closed below major exponential moving averages, creating resistance between $397 and $404.
    • Technical indicators showed mild bearish pressure, but the low ADX reading signaled weak trend strength.
    • Traders identified $390 as crucial support, while a break above $404 could improve the technical structure.
    • Analysts highlighted bear-trap signals, price compression, and a multi-month symmetrical consolidation triangle.

    Tesla stock (NASDAQ: TSLA) closed slightly higher during the latest session, but it failed to maintain an early move above $400. Technical indicators showed weak momentum, while three traders identified competing short-term and longer-term price structures. Consequently, TSLA stock remains within a narrow range as traders assess support, resistance, and possible breakout signals.


    TSLA Stock Card
    Tesla, Inc., TSLA

    Tesla Ends Session Below Key Moving Averages

    TSLA stock gained 0.45% and closed at $396.52, according to the latest TradingView market data. The shares opened at $399.05 and reached an intraday high of $402.22. However, sellers pushed the price toward $394.76 before the closing bell.

    Tesla finished below its 20-day, 50-day, and 100-day exponential moving averages. Those averages currently sit between $402.31 and $403.64, creating a concentrated resistance area. The shares also closed below the 200-day exponential moving average at $397.29.
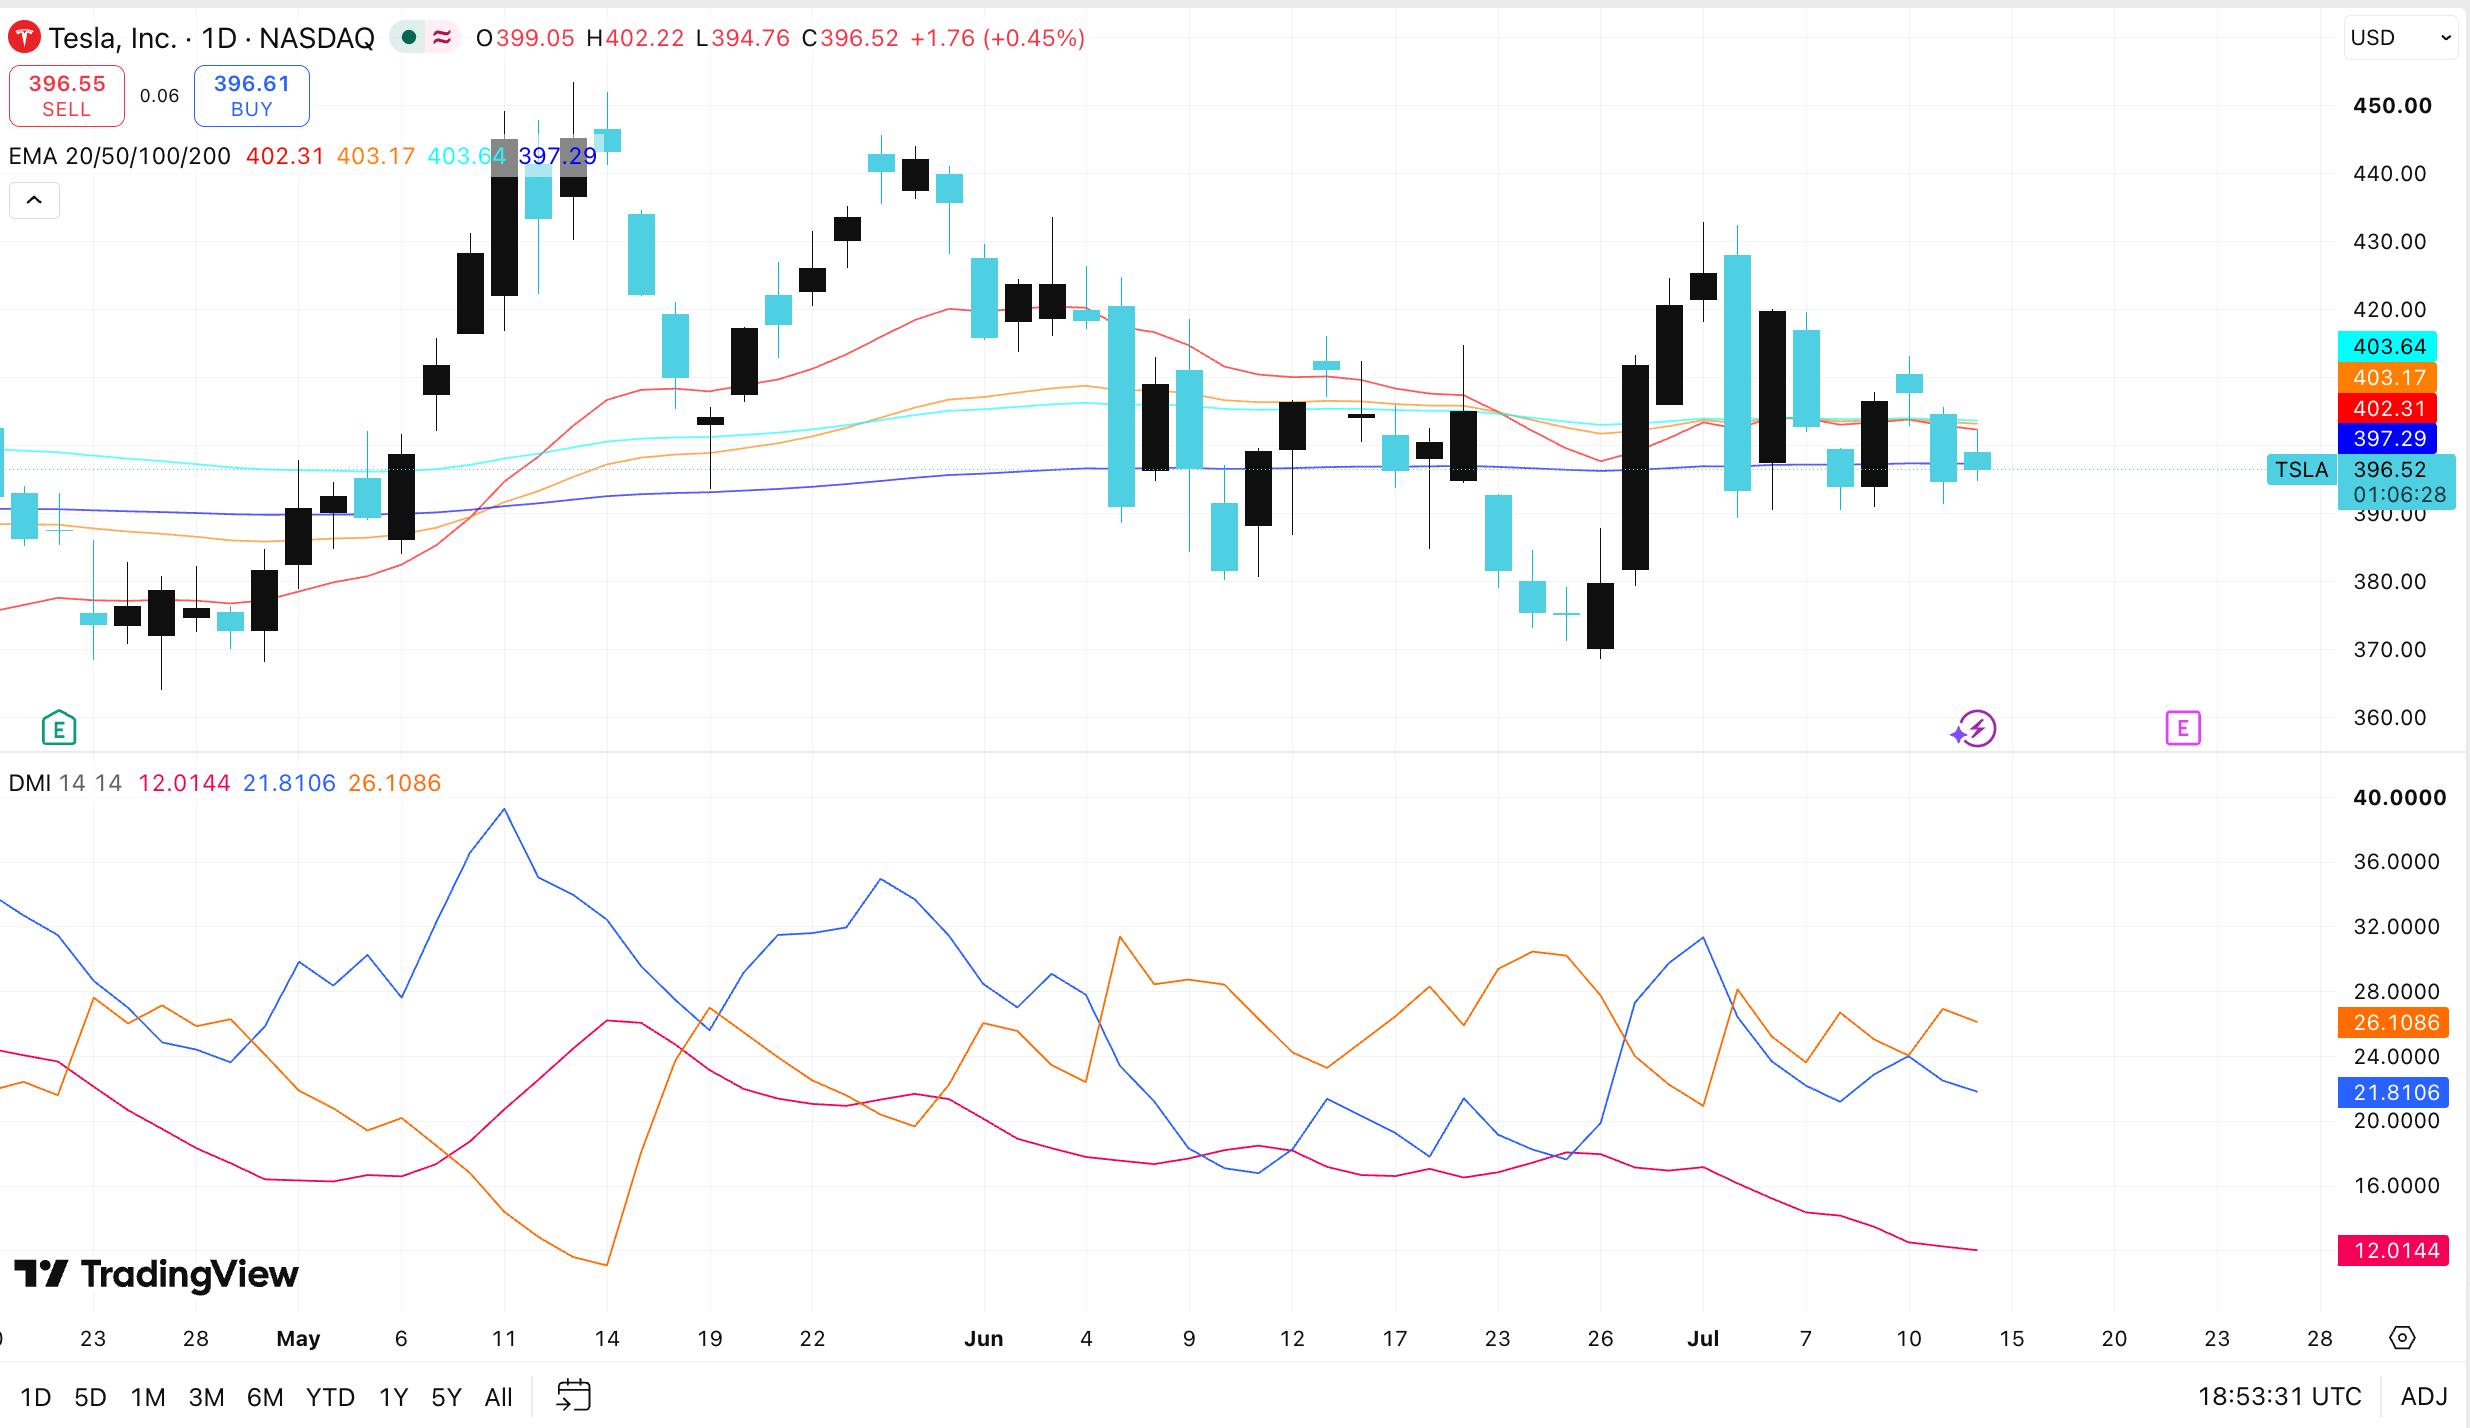
    TSLA/USD 24-hour price chart source: TradingView

    Immediate resistance now extends from approximately $397 to $404, while nearby support remains at $394.76. A lower support zone sits near $390, which traders identified as an important structural level. Therefore, TSLA stock needs a decisive move beyond either boundary to establish clearer direction.

    TSLA stock currently faces mild bearish pressure based on readings from the Directional Movement Index. The negative directional indicator stands at 26.11, exceeding the positive indicator reading of 21.81. That difference shows sellers held a modest advantage during the measured period.

    However, TSLA stock recorded an Average Directional Index reading of only 12.01. Such a low reading indicates that neither buyers nor sellers currently control a strong trend. Therefore, price compression could continue until trading activity strengthens around the established boundaries.

    A break above $404 would place the shares beyond several closely grouped moving averages. Conversely, a drop below $390 would weaken the current structure and expose lower support areas. Until either event occurs, the stock may continue moving between nearby support and resistance levels.

    Traders Outline Different Breakout Scenarios

    TSLA stock has also attracted several technical interpretations across different chart periods. CoinvoTrading described the recent decline near $400 as a possible bear trap within a broader psychological cycle. The trader’s daily chart projected a recovery after earlier euphoria, anxiety, and capitulation phases.

    🚨 $TSLA HAS JUST FOOLED EVERYONE

    The bear-trap on Tesla has fooled thousands of traders already.

    MONTH 1-2: Euphoria + optimism.

    MONTH 2-4: Anxiety + capitulation.

    MONTH 4-7: Recovery + bull trap (here now).

    This is where most people fade a stock that is about to explode.… pic.twitter.com/F8golsnPGp

    — Coinvo Trading (@CoinvoTrading) July 14, 2026

    Meanwhile, @EWTracker placed TSLA stock inside a multi-month symmetrical consolidation triangle. The chart showed the current price near the middle of the formation, rather than either boundary. According to the analysis, repeated trendline tests could delay a confirmed breakout until September or October.

    $TSLA I’m still watching for the end of the consolidation triangle.

    But it could take until as long as September or October to make a real move. The market can always extend the delay with another push of the top trendline, then a push of the bottom trendline.

    Selling puts… pic.twitter.com/oEyMu24L2n

    — Tracker (@EWTracker) July 14, 2026

    Separately, @optionflys identified compression between descending resistance and rising support on the one-hour chart.

    $TSLA 1-Hour

    Price is compressing between descending resistance and rising support.

    A break above the trendline opens the door toward 413, then 420.

    A break below 389.30 invalidates the current bullish structure.

    Don’t predict the breakout.

    Let price make the decision.$SPX… pic.twitter.com/CqCkA5FldY

    — Mo (@optionflys) July 14, 2026

    The trader listed $413 and $420 as upside levels, while a fall below $389.90 would invalidate the bullish structure. Overall, TSLA stock remains range-bound after closing at $396.52 and failing to secure support above $400.

    Share. Facebook Twitter Pinterest LinkedIn Tumblr Email

    Related Posts

    Capital B Raises €21M From Adam Back And TOBAM

    August 31, 2026

    What XRP holders should know

    August 31, 2026

    Crude Oil Surges as U.S. Military Action Targets Iran Near Key Shipping Corridor

    August 31, 2026

    HTX Turns 13 with Resilience in Action

    August 31, 2026
    Add A Comment

    Comments are closed.

    Tweets by InfoAltcoinvest

    Top Posts

    Capital B Raises €21M From Adam Back And TOBAM

    August 31, 2026

    What XRP holders should know

    August 31, 2026

    Crude Oil Surges as U.S. Military Action Targets Iran Near Key Shipping Corridor

    August 31, 2026

    Ethereum Price Forecast Eyes Breakout as ETH Tests $1,800

    July 8, 2026

    The Hidden Giant of the Next Bull Run: Hyperliquid Explained (HYPE Token to $100 This Year…)

    March 31, 2026

    DeXe hits new ATH, targets $40 – THESE 2 indicators back bulls

    July 10, 2026

    I Was WRONG About Bitcoin…………….. 🚨🚨 ………… [how did we miss this?]

    June 7, 2026

    Altcoinvest is a leading platform dedicated to providing the latest news and insights on the dynamic world of cryptocurrencies.

    We're social. Connect with us:

    Facebook X (Twitter)
    Top Insights

    Seeker’s euphoric rally meets holder exits – Can SKR’s momentum hold?

    August 31, 2026

    Capital B Raises €21M From Adam Back And TOBAM

    August 31, 2026

    Bitcoin Holds $78K As Strait Of Hormuz Strike Lifts Oil Above $90

    August 31, 2026
    Get Informed

    Subscribe to Updates

    Get the latest creative news from FooBar about art, design and business.


    Facebook X (Twitter)
    • Home
    • About us
    • Contact Us
    • Privacy Policy
    • Terms & Conditions
    © 2026 altcoinvest.com

    Type above and press Enter to search. Press Esc to cancel.