






TLDR:
- Bitcoin’s net capital flow divergence has returned, echoing the signal seen near the 2022 cycle bottom.
- A 157-day futures basis drought now ranks as Glassnode’s second-longest period below Treasury yields.
- Bitcoin trades just above its $63,777 200-week SMA, a level repeatedly linked to past cycle recoveries.
- Three independent indicators now converge, but none confirms that Bitcoin’s final market bottom is in.
Bitcoin is showing several market-bottom indicators that previously appeared near major cycle turning points, according to data shared by Ali Charts and Rand Group. The signals combine weakening net capital flows, unusually subdued futures returns, and Bitcoin’s proximity to its long-term 200-week simple moving average.
Net Capital Flows Recreate a 2022 Divergence
Ali Charts highlighted a bullish divergence between Bitcoin’s price and net capital flows, describing it as the same pattern seen near the 2022 cycle bottom. During that earlier period, Bitcoin traded near $15,000 before beginning a sustained advance that eventually reached $126,000, representing an approximately eightfold increase.
Basically, a bullish divergence occurs when price remains weak while an underlying flow indicator improves, showing that selling pressure and capital movement are no longer moving together. Although the current signal does not establish a confirmed bottom by itself.
Instead, it reproduces a relationship that previously appeared as Bitcoin completed its last major bear-market decline. That comparison has gained additional weight from derivatives data, where market activity has remained unusually quiet despite Bitcoin trading far above its 2022 low.
Futures Returns Trail Treasury Yields for 157 Days
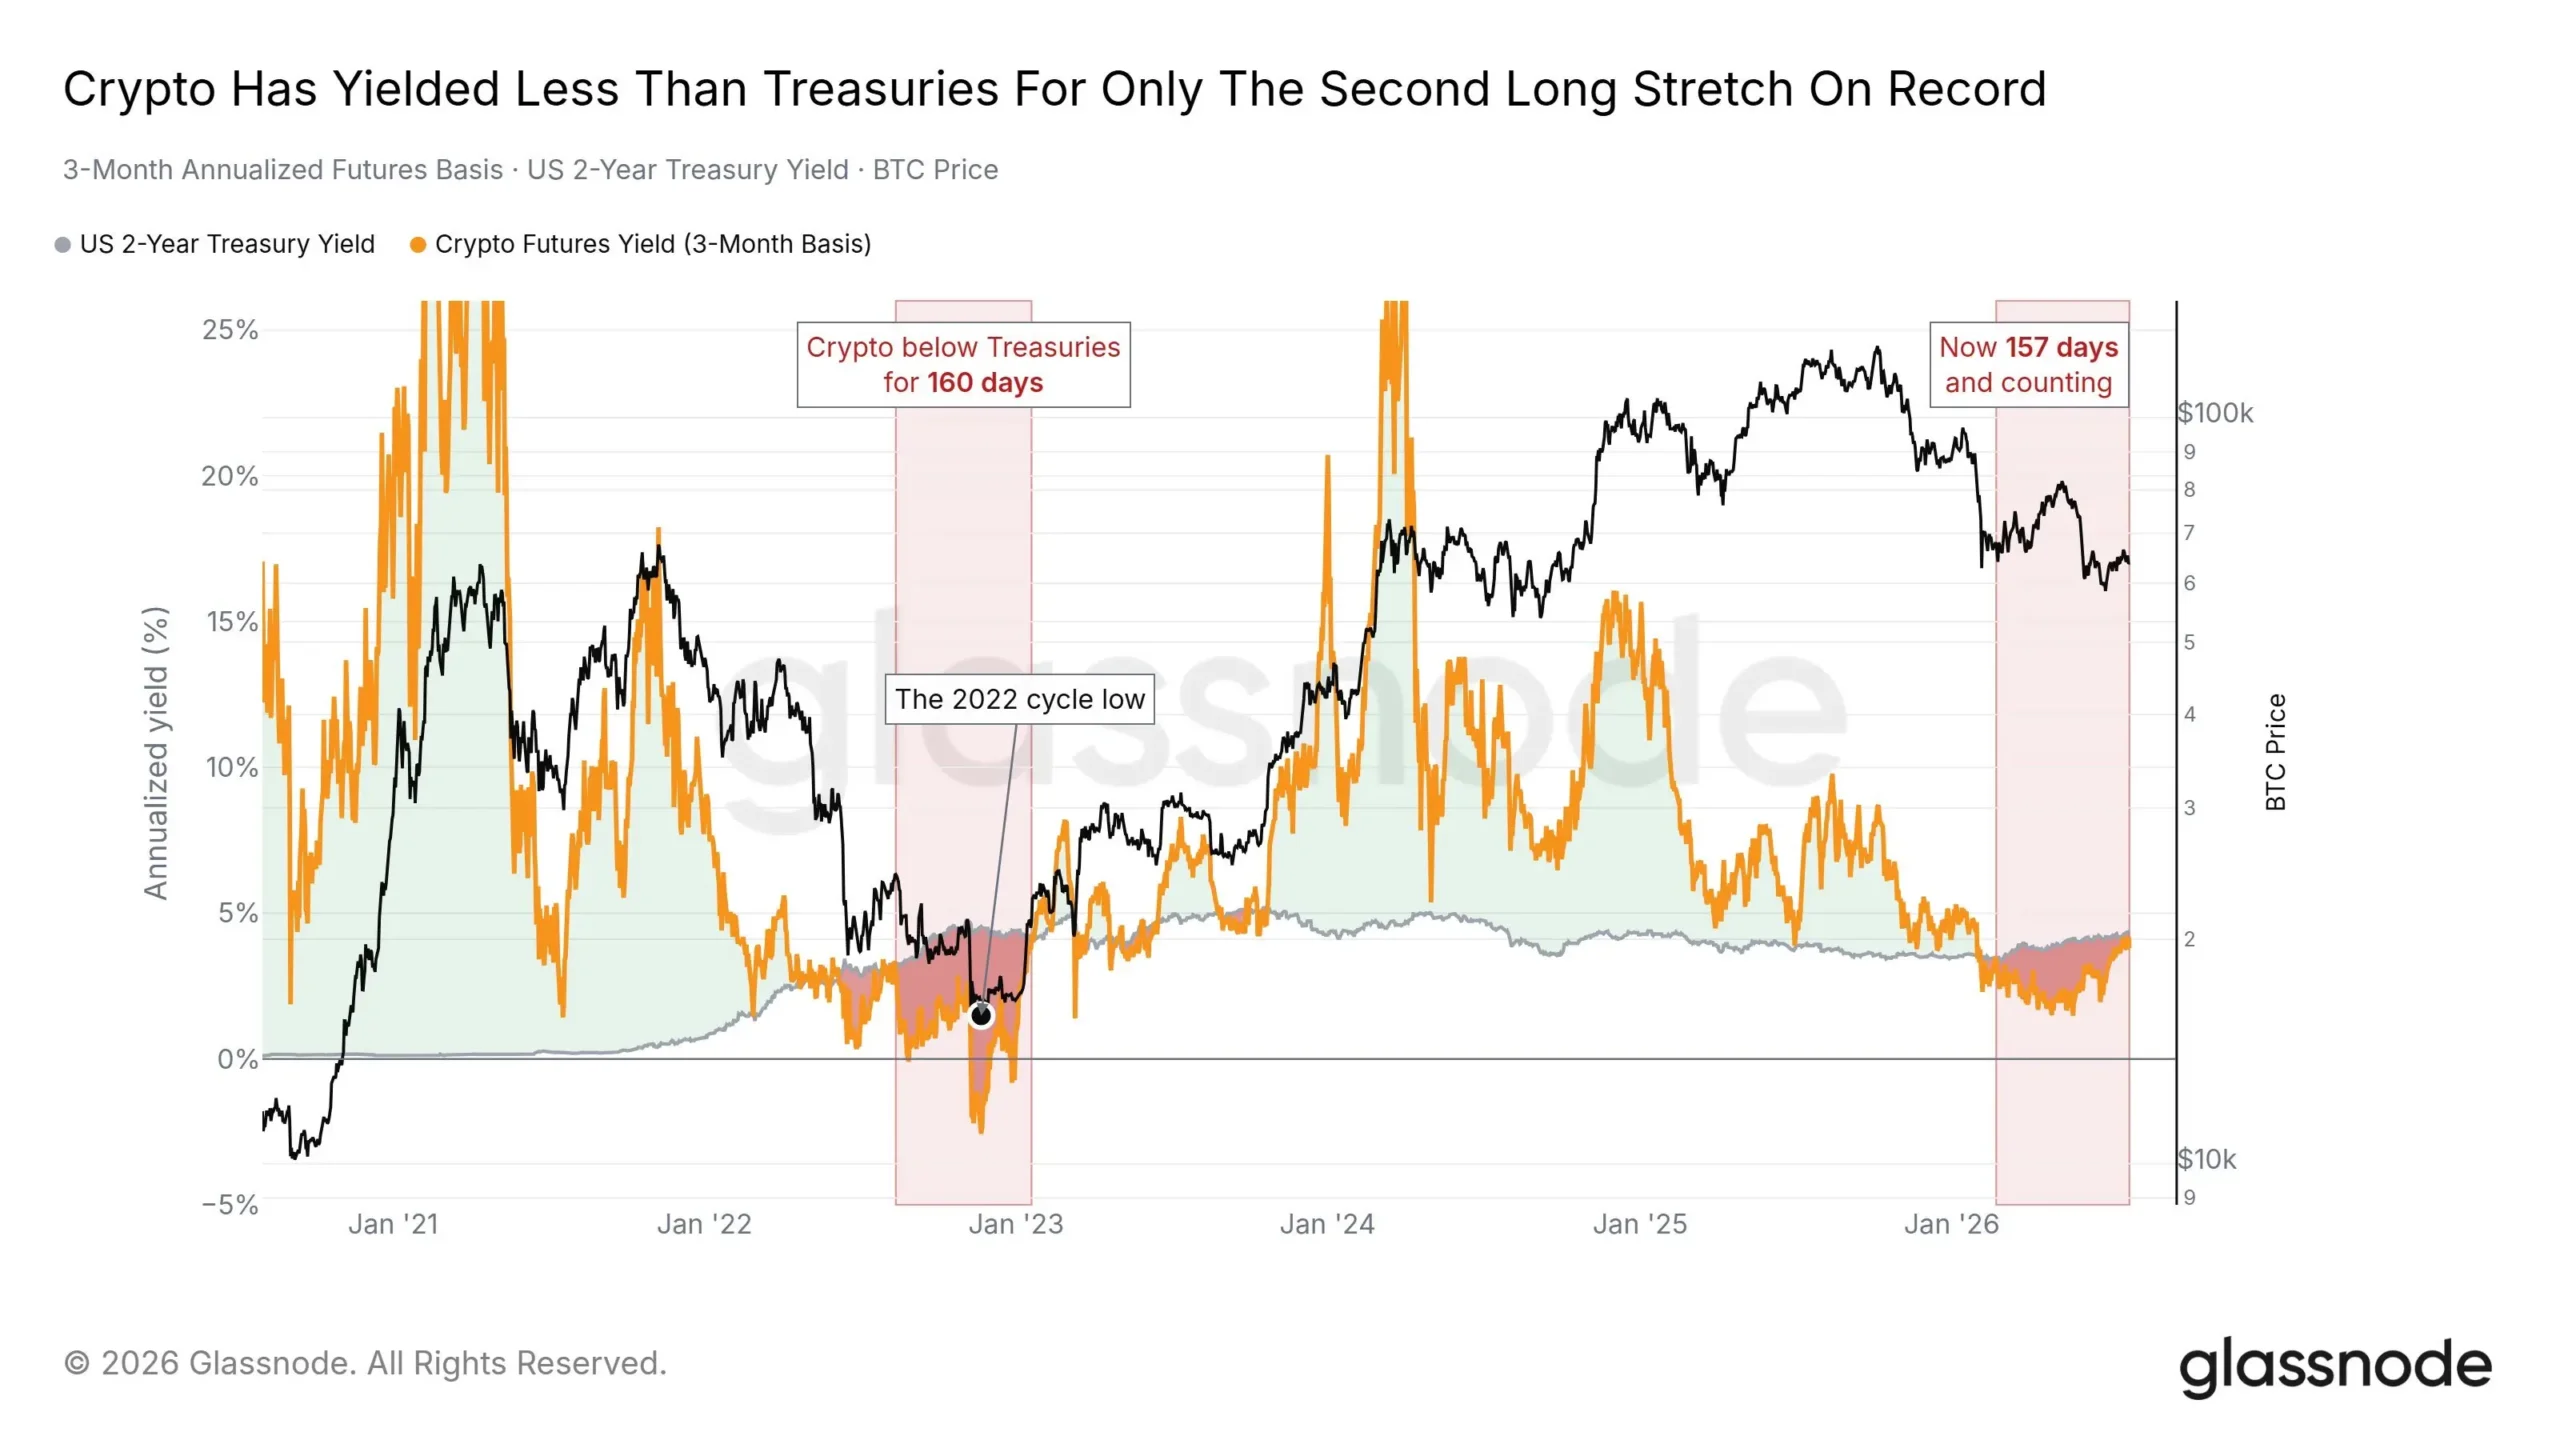
Adding to the broader market-bottom comparison, Rand Group cited Glassnode data showing a prolonged decline in Bitcoin futures returns. Bitcoin’s three-month annualized futures basis has remained below the two-year United States Treasury yield for 157 consecutive days.
The futures basis measures the annualized premium available when futures contracts trade above Bitcoin’s spot price. Therefore, a lower basis generally reflects weaker demand for leveraged bullish positions.
Source: X
At the same time, Treasury securities offer investors a competing, relatively low-risk return. Consequently, when Bitcoin’s futures basis falls below government bond yields, institutional traders have less financial incentive to allocate capital to crypto futures.
According to Glassnode’s chart, the current 157-day stretch is the second-longest occurrence recorded in the dataset. The only longer period lasted approximately 160 days between August 2022 and January 2023.
Notably, that earlier stretch coincided with Bitcoin’s cycle-low formation after months of declining prices, institutional failures, and widespread deleveraging across the cryptocurrency market.
Rand Group added that investors who exited Bitcoin during that inactive period subsequently missed an approximately eightfold price expansion. Nevertheless, the historical comparison highlights similarities in market positioning rather than predicting an identical price outcome.
The 200-Week Average Defines the Accumulation Zone
Alongside the derivatives signal, Ali Charts identified the 200-week simple moving average as Bitcoin’s long-term cycle benchmark. The indicator currently stands at $63,777. Meanwhile, Bitcoin traded near $64,620, placing the asset approximately $843 above the moving average and inside a historically important technical area.
Bitcoin previously tested this benchmark in August 2015, December 2018, March 2020, and throughout the second half of 2022. Those episodes were followed by reported gains of 8,500%, 267%, 1,125%, and 680%, respectively, although each developed under different market conditions.
Given the possibility of further declines, the analyst’s buying plan involves dollar-cost averaging between $58,000 and $40,000. The strategy also recognizes potential downside targets near $54,000 and $40,000.
More importantly, the indicators complement one another as each measures a different aspect of Bitcoin’s market structure. Capital flows track the movement of money, while the futures basis reflects derivatives positioning. At the same time, the moving average measures Bitcoin’s long-term price trend.
Taken together, the data presents three simultaneous developments: an improving flow divergence, compressed derivatives returns, and a test of a decade-long moving-average benchmark.
However, none of these indicators independently confirms that Bitcoin has established its final market bottom. Instead, their convergence places current conditions near measurable levels associated with the previous cycle’s accumulation phase.
