





The most recent attempt to stabilize around $1.00 has not yet resulted in a significant reversal signal, and XRP is still trapped in a clear downtrend. After momentarily falling below the psychological $1 threshold, the asset is currently trading close to $1.002, placing XRP at one of its most technically sensitive levels of 2026.
The next significant dynamic resistance is located around $1.08, and XRP is currently trading below the short-term average near $1.04. More significantly, the longer-term averages continue to be significantly higher at roughly $1.16 and $1.35.
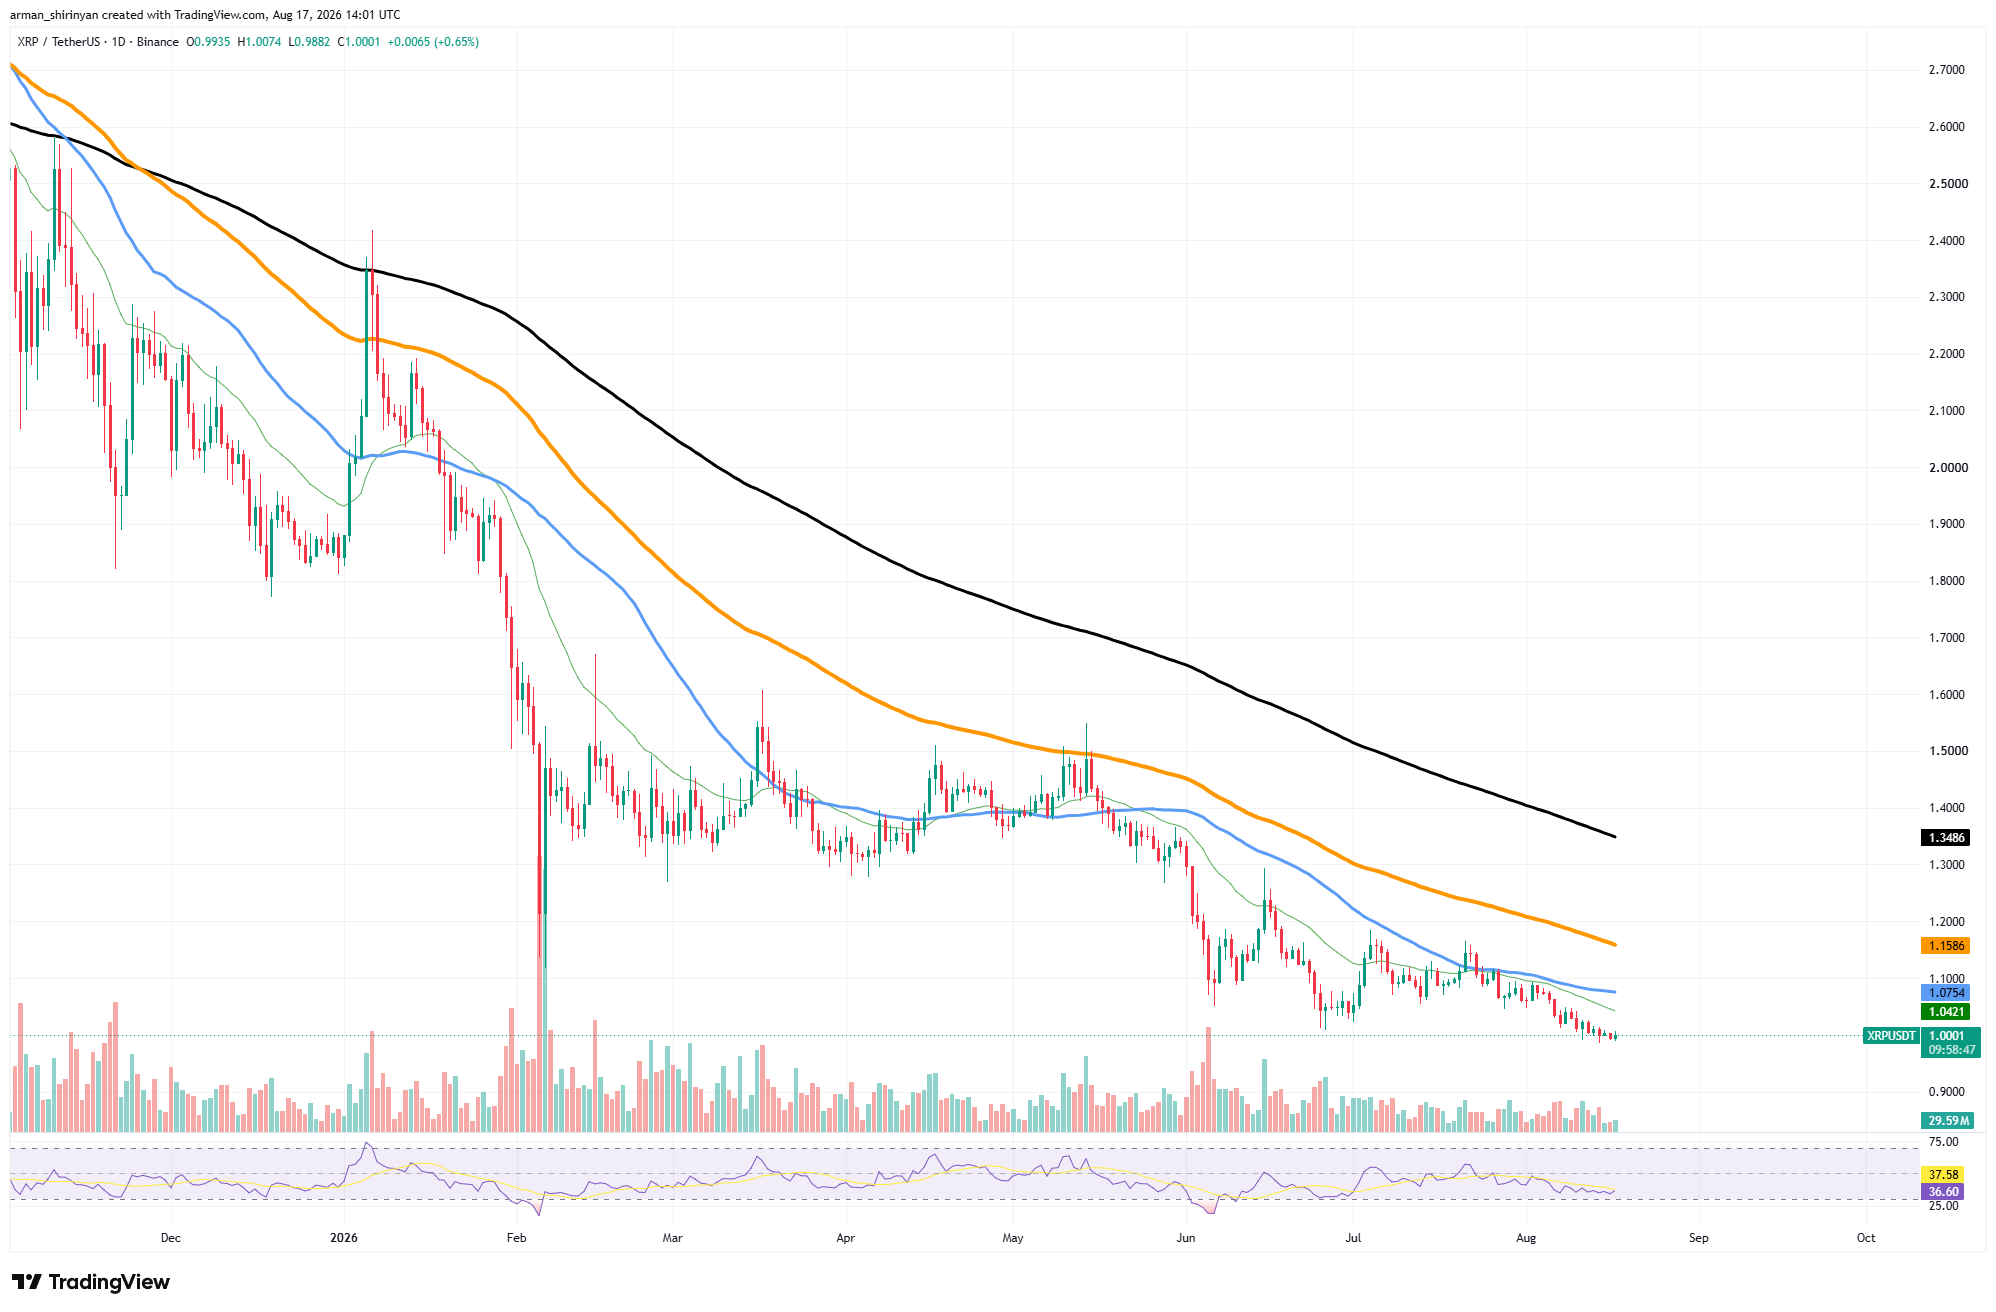
The fact that $1.00 has not responded strongly is the immediate problem. Although buyers have so far stopped a clear breakdown, XRP is still printing lower highs and lower lows.
XRP, Bitcoin (BTC), Shiba Inu (SHIB) and Zcash (ZEC) Price Analysis for August 18: Market Volumes Fly Over the Top
461,981% Gain: Satoshi-Era Bitcoin Address Awakens After 15 Years
You Might Also Like

XRP must first reclaim the $1.04–$1.08 region in order to achieve a short-term recovery. A move above $1.08 would reveal the $1.15–$1.16 resistance zone and significantly improve the setup.
Rebounds are still susceptible to fresh selling until then. On the downside, XRP would have little obvious support right below if it lost $1.00 on a daily closing basis. The next sensible area to keep an eye on would be the $0.95 region.
Therefore, until buyers are able to transform the current $1.00 defense into an actual higher-low structure instead of just another brief pause, XRP remains bearish.
Bitcoin averaging down
Although Bitcoin’s overall technical structure is still weak, it is exhibiting significantly more stability than XRP. After spending most of August consolidating in a relatively small range following the dramatic June sell-off and subsequent recovery from below $60,000, Bitcoin is currently trading at about $63,650.
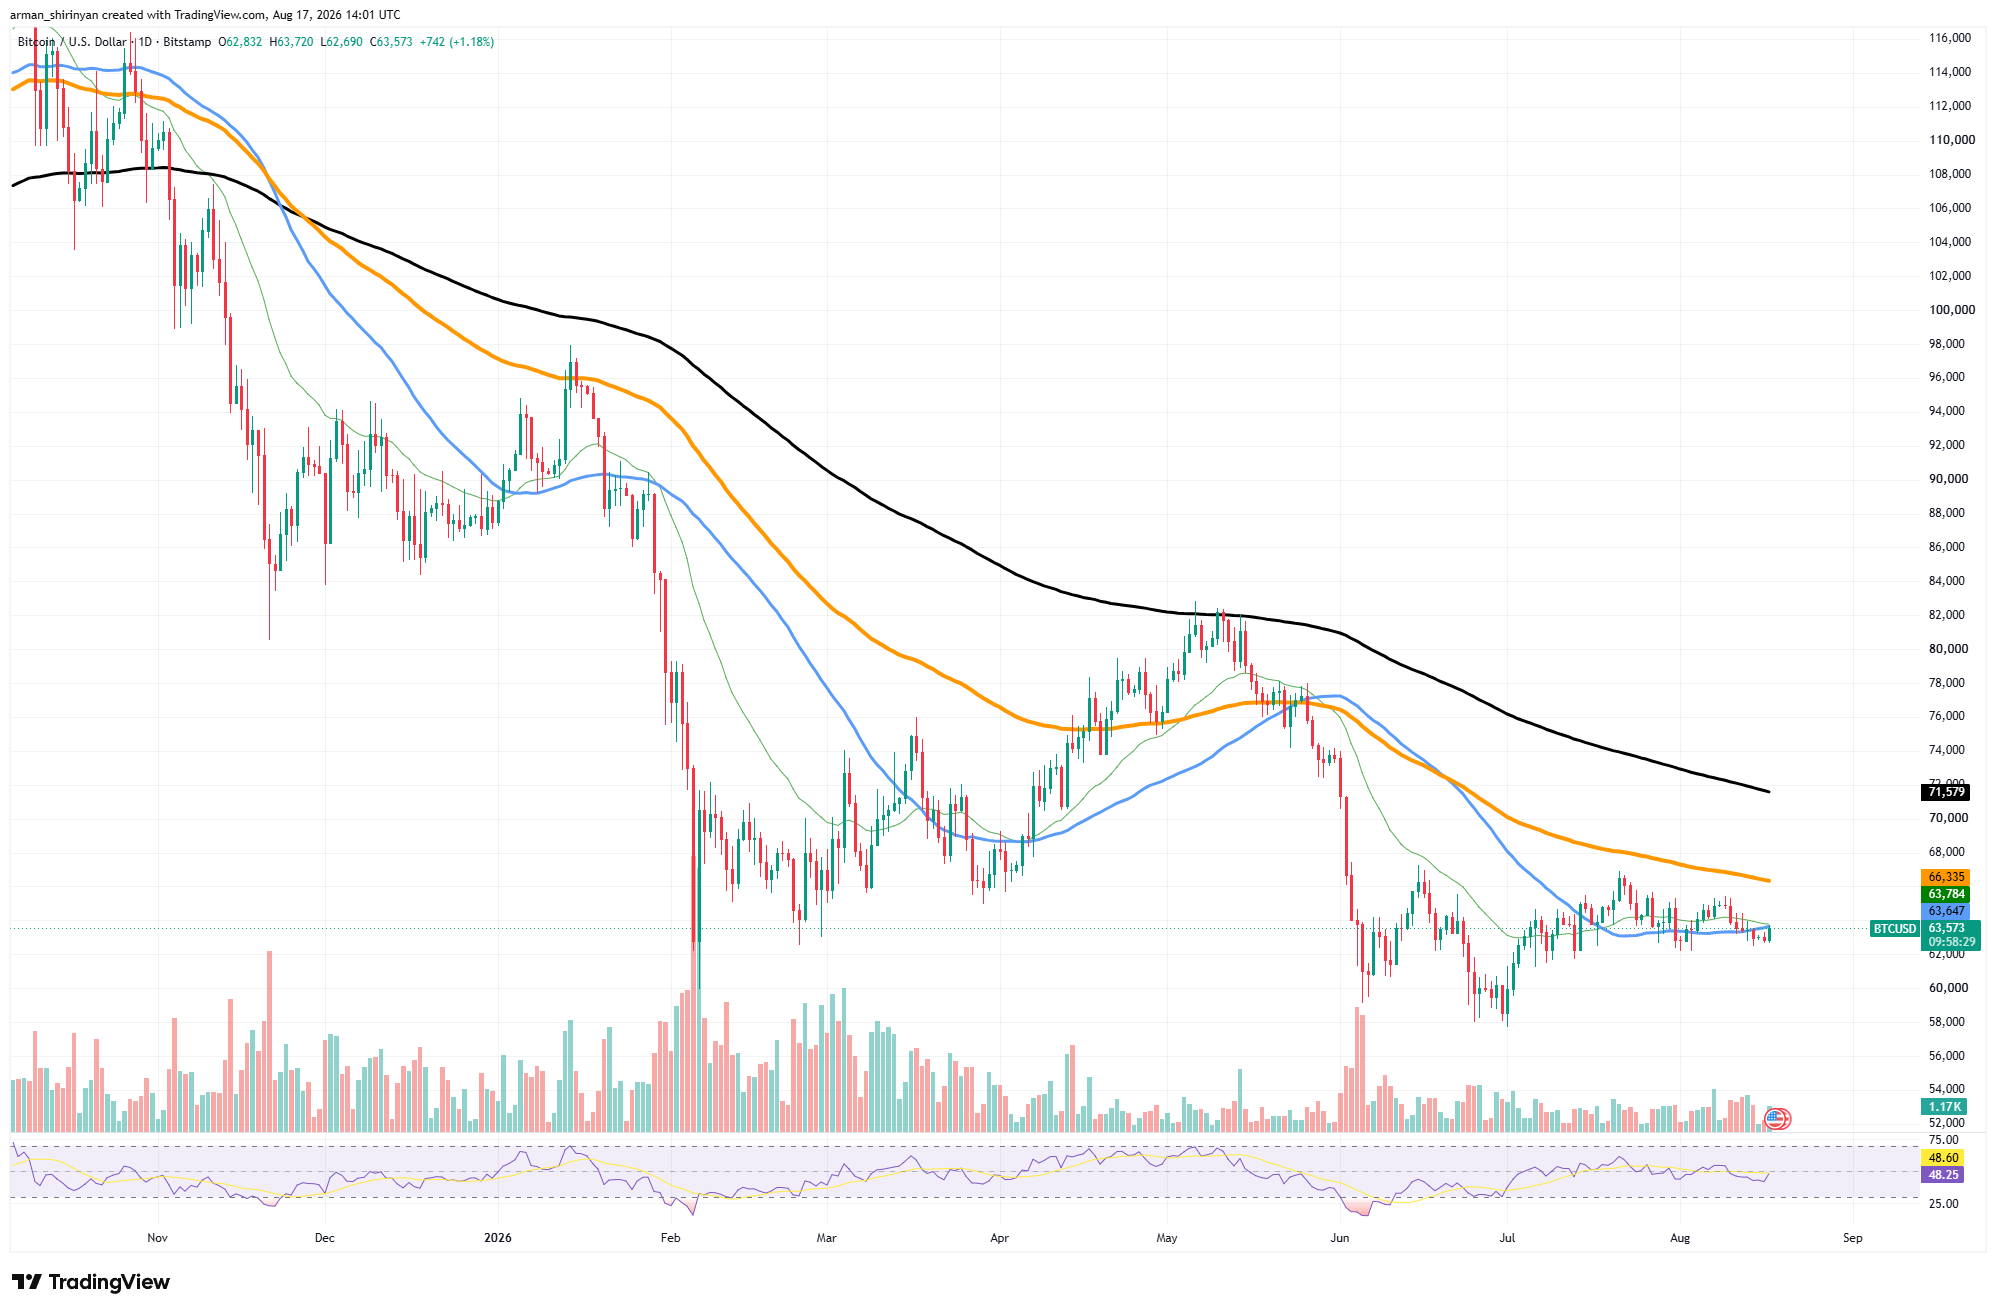
The way Bitcoin interacts with the moving averages centered around the current price is the most significant short-term development. Since Bitcoin is almost exactly on the short-term averages between $63,650 and $63,800, buyers and sellers are immediately engaged in a battle in the $63,000 to $64,000 range.
The price is no longer significantly lower than these averages, in contrast to the June decline. However, this stabilization has not resulted in a more widespread reversal of the trend. While the long-term average is significantly higher at $71,600, Bitcoin is still below the declining intermediate moving average at $66,300.
You Might Also Like

Following the previous volatility, the market is essentially contracting. The first significant bullish signal would come from a move above $66,300, which might pave the way for a move toward $70,000–$71,600. Regaining the latter would be a far more significant structural advancement.
Shiba Inu at the lower end of the range
With the current consolidation around $0.00000447 doing little to challenge the larger bearish structure, Shiba Inu is still stuck close to the bottom of its 2026 range.
After declining in July, SHIB has been able to stabilize, but buyers have not yet shown the follow-through required for a real trend reversal. The moving averages make the issue very clear. At roughly $0.00000447–$0.00000457, SHIB is trading almost exactly around the short-term averages, forming a compressed local structure.
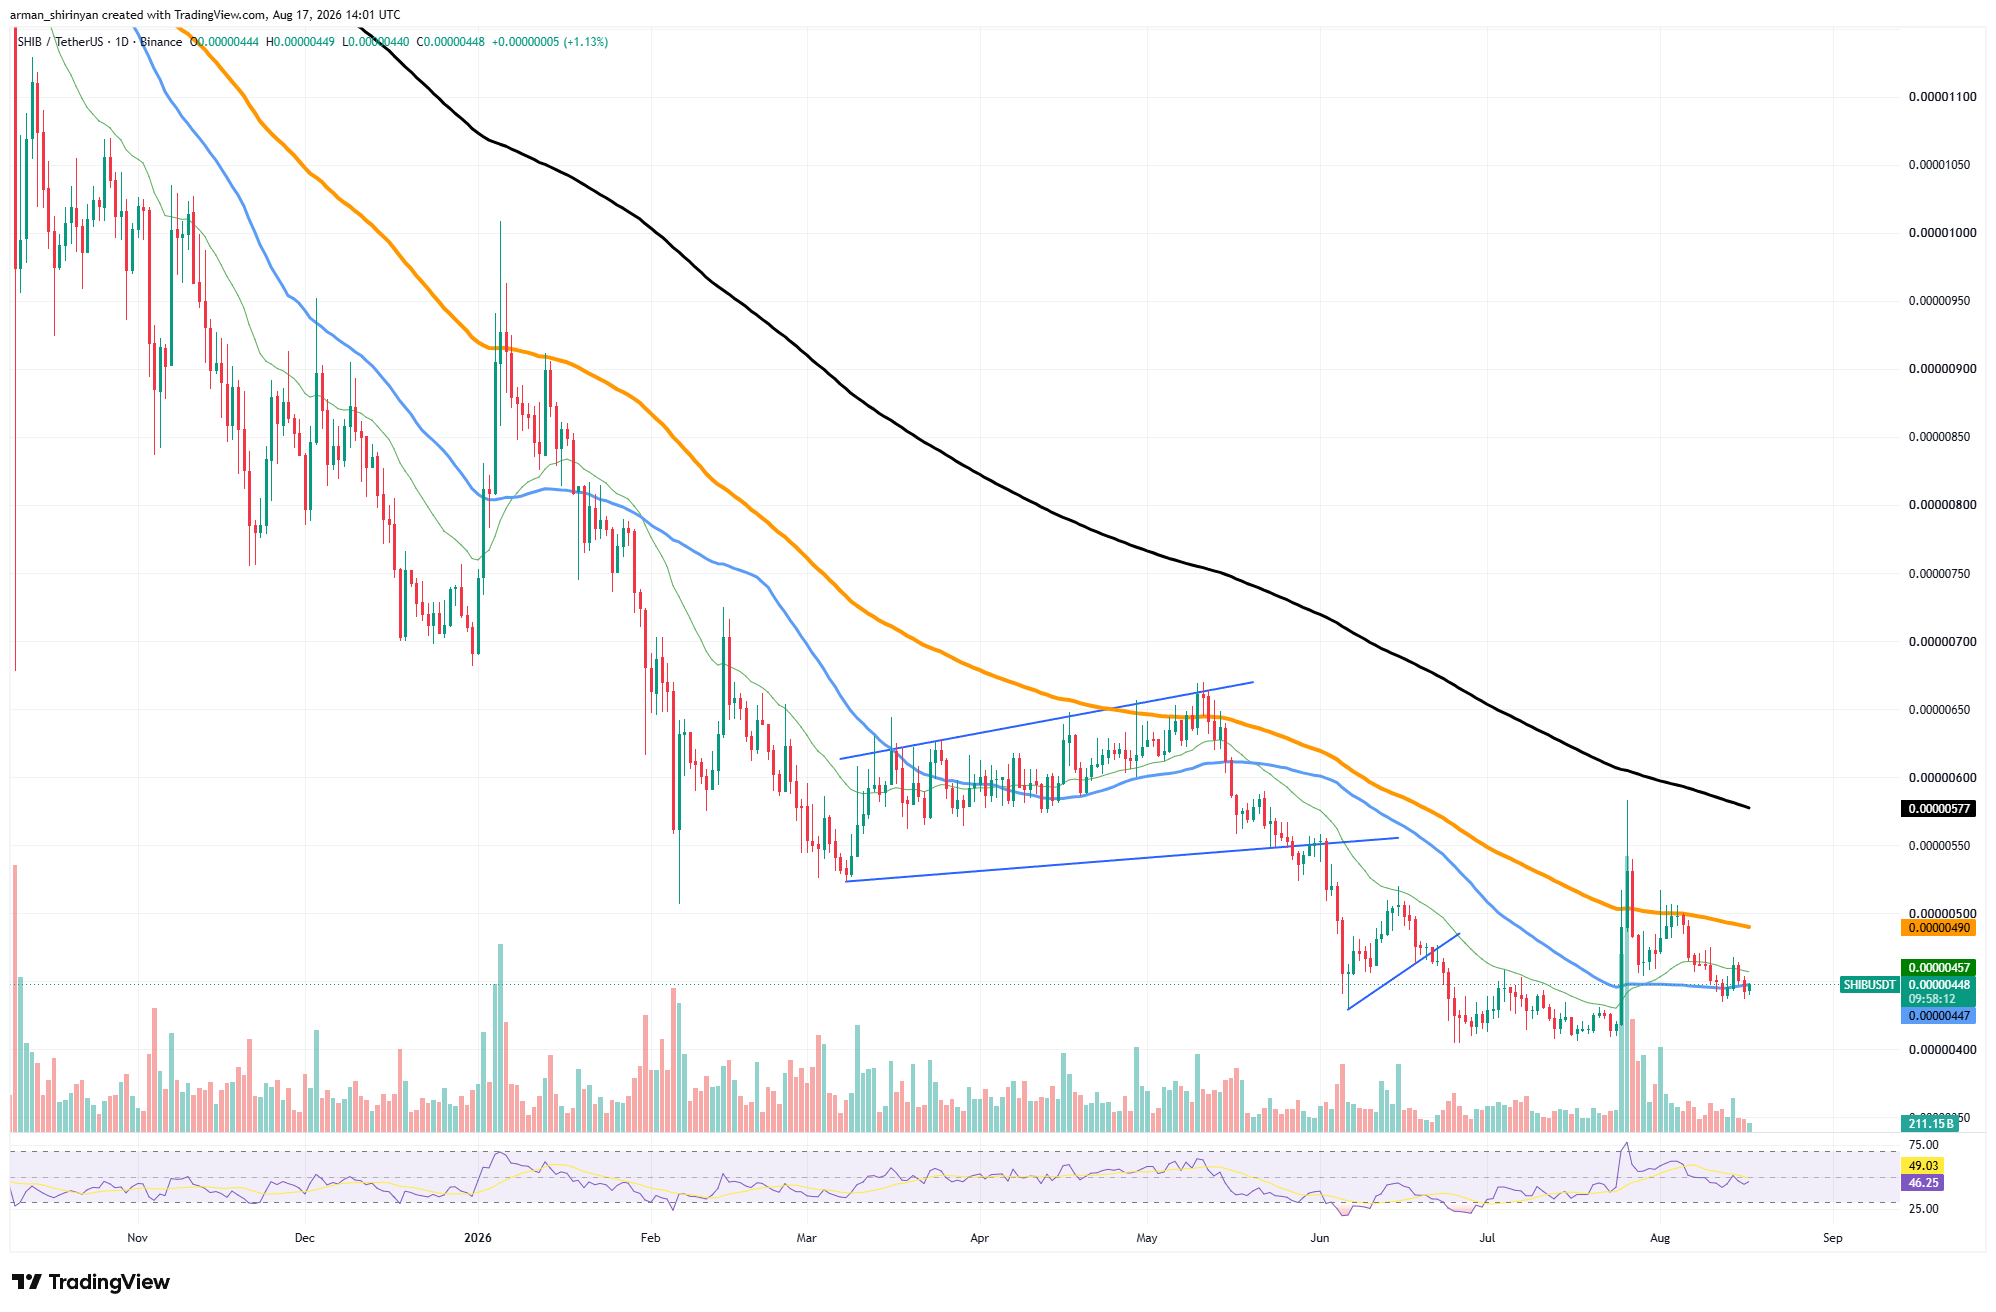
The more significant resistance, however, is still above: the long-term average is much higher near $0.00000577, and the intermediate moving average is located around $0.00000490. With a significant increase in volume, the late-July volatility spike momentarily drove SHIB toward $0.0000058.
Because of this rejection, the $0.0000049–$0.0000050 region is especially crucial. Before the market structure can improve, another breakout attempt must pass through this zone and remain above it. As of right now, momentum provides minimal directional confirmation.
You Might Also Like

The RSI is currently at about 46, which is far from oversold territory but below the neutral 50 level. This implies that SHIB could continue moving sideways without necessarily triggering a significant rebound. The immediate support region is located between $0.0000043 and $0.0000044. Losing it would expose the psychological $0.0000040 level and the July lows around $0.0000041.
The initial goal for bulls is to recover $0.0000049. The path toward $0.0000055–$0.0000058 could be reopened by a sustained move above $0.0000050. Until then, SHIB’s stabilization appears to be more of a consolidation at the lows than a confirmed recovery.
Zcash remains strong technically
Despite significant volatility, Zcash still has one of the stronger technical structures on the chart. After gaining about 5% on the most recent daily candle, ZEC is currently trading at $511. This keeps the price above all of its major moving averages and maintains the larger recovery structure that has been in place since the March–April bottom.
The $490–$500 range is where the immediate setup is concentrated. While another significant average is situated lower at roughly $472, the short-term moving averages are grouped around $493–$495. Since late July, ZEC has frequently traded in this region, but sellers have been unable to force a prolonged breakdown. $490 is therefore especially crucial.
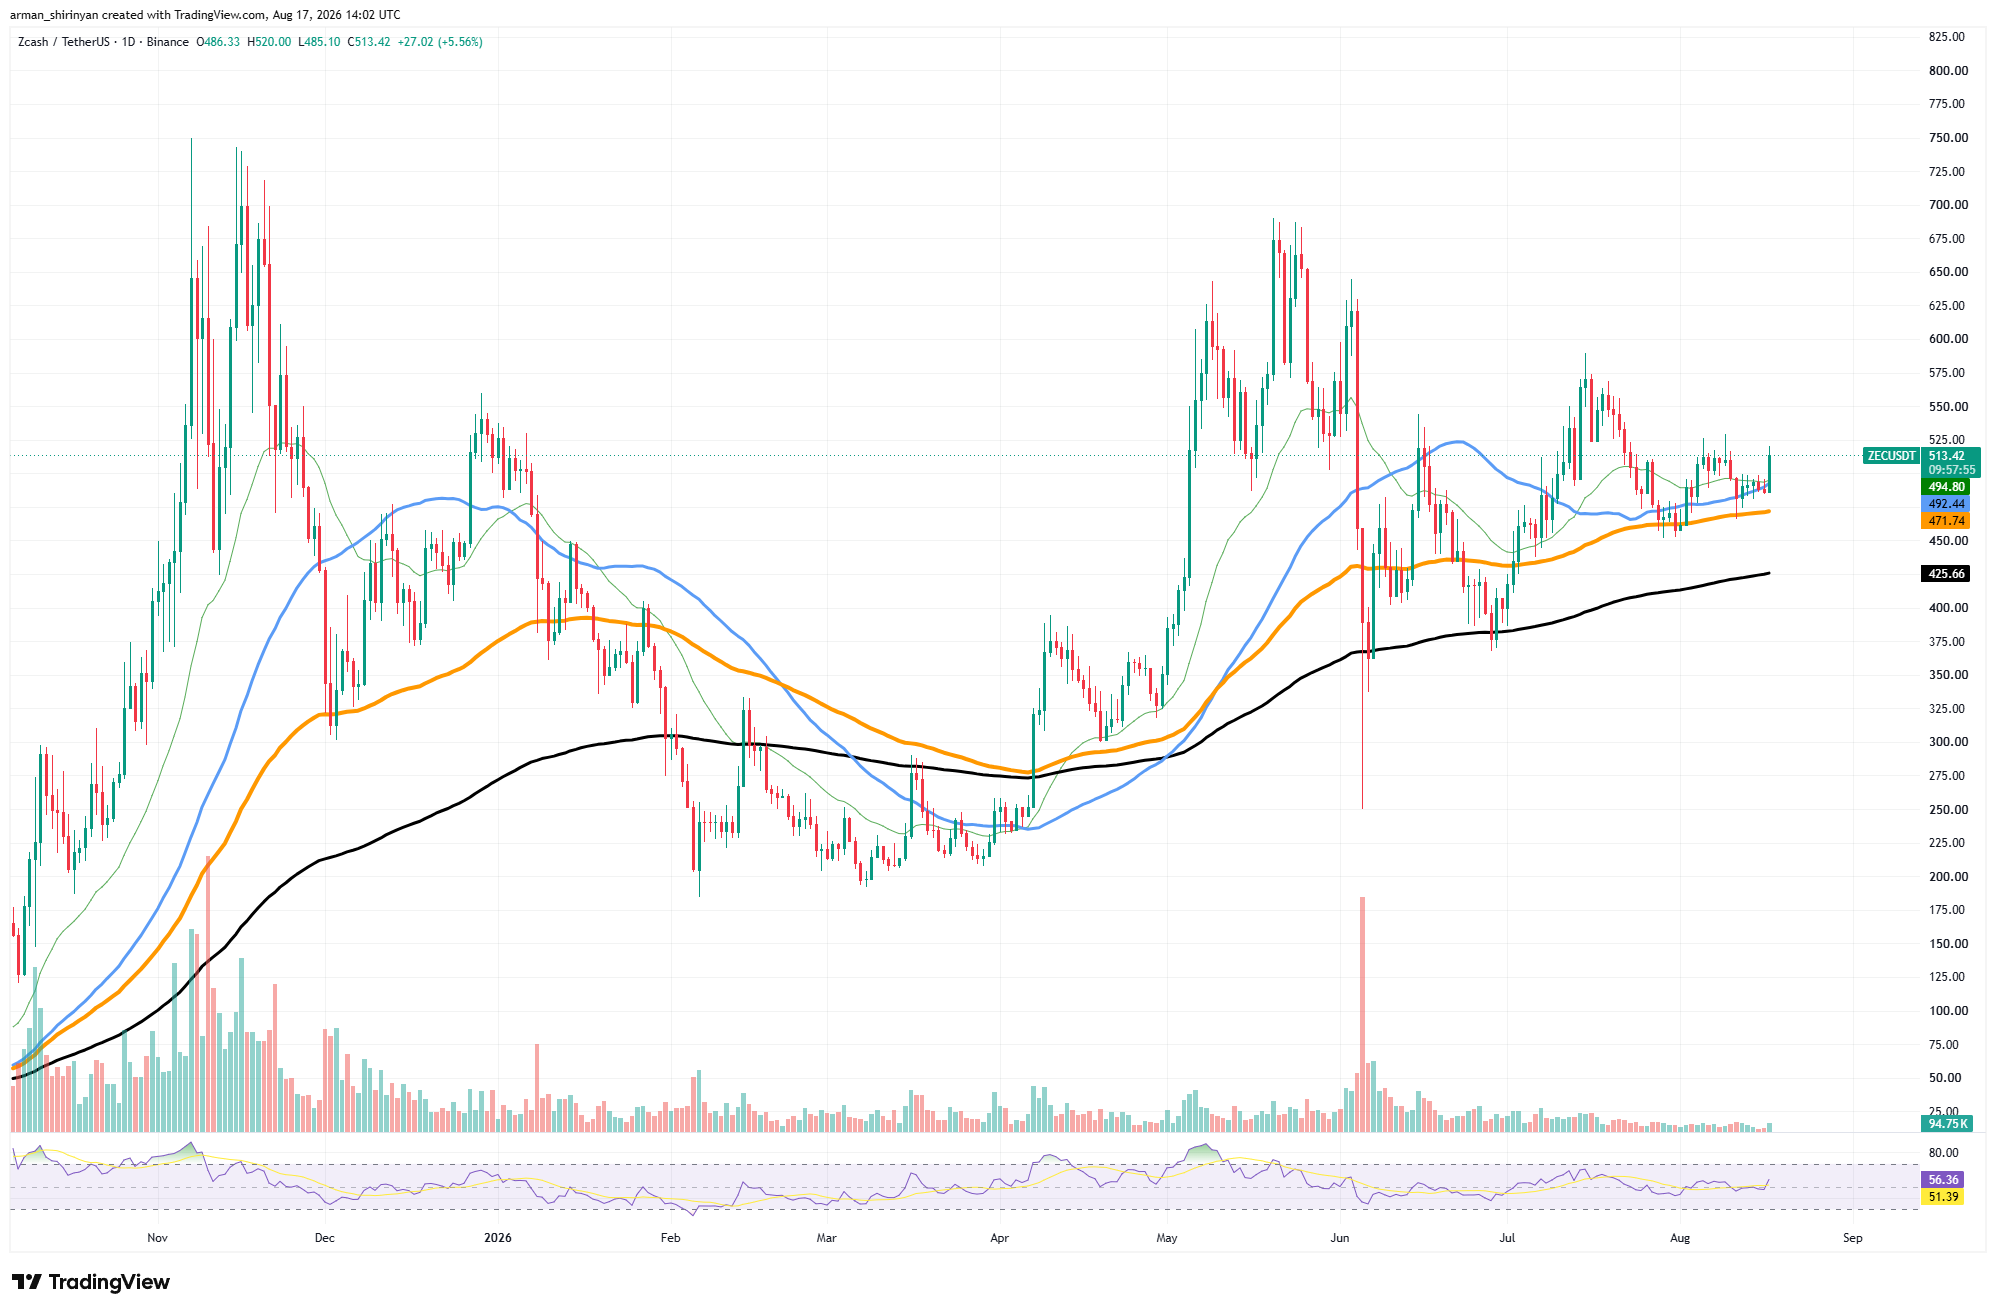
By staying above it, ZEC has another chance to attack the recent resistance around $520–$530 and maintains the constructiveness of the current structure. Attention would probably shift to $550–$570, where the previous July rally faced strong selling pressure, if there were a clear breakout above that region.
Compared to what the short-term price action indicates, the larger trend is still much stronger. The long-term moving average for ZEC is currently close to $426 and is still rising.
You Might Also Like

As a result, even after several months of erratic consolidation, the price maintains a sizable cushion above its main trend support. Declining volume is the primary weakness. A breakout from the current range would benefit from a noticeable increase in participation, as recent trading activity is significantly lower than that of the major May and June moves.
If ZEC drops below $490, $470-$475 will be the next significant support. The technical picture would deteriorate below that level, with $425–$430 emerging as the primary structural support.