

 Price Rockets Over 100% Overnight: Too Late to Jump In?")
Key Notes
- ARDR price has surged over 100% to around $0.13 in just one day.
- 24-hour trading volume spiked by 770%, reaching $547 million.
- Nearly 90% of inflows came via the KRW pair, hinting at possible bullish developments.
Ardor
ARDR
$0.14
24h volatility:
55.9%
Market cap:
$136.81 M
Vol. 24h:
$617.72 M
has recently rallied over 100% in the past 24 hours to trade around $0.13. This explosive move has doubled its market cap to $140 million, pushing the altcoin to the 248th spot among the largest cryptocurrencies.
Notably, ARDR had been moving within a descending parallel channel since December 2024. However, since April 15, the chart has printed two massive green candles, signaling an abrupt break from months of bearish structure.
The altcoin has also seen a dramatic 770% rise in its 24-hour trading volume, currently at $547 million. As the broader crypto market largely recorded a slow motion, ARDR’s parabolic price movement led to curiosity across trading desks.
A Deeper Dive
It is interesting to note that around 90% of the daily inflow was routed through the KRW trading pair. This has fueled speculations that a Korea-centric announcement or strategic partnership may be underway. However, no official confirmation has emerged yet.
Moreover, Binance recently added ARDR in its second batch of “Vote to Delist” tokens — a move that generally results in a price slump. However, the announcement appears to have ignited a defense from the community.
Many believe that the surge could be a coordinated effort by supporters to create a short-term demand shock and prevent the token’s removal from the exchange.
ARDR Price Outlook
The latest ARDR price spike is its most aggressive move since November 2024, and while the momentum is undeniable, the sustainability remains under scrutiny.
Some market voices on X urge caution, recommending profit-booking to avoid potential FOMO-driven losses.
On the daily ARDR price chart, the RSI is around 81, deep into the overbought territory. While this shows strong buying pressure, it also raises concerns of a potential short-term pullback if bulls fail to maintain momentum.
Key immediate support lies around $0.10. A break below this could trigger further downside toward $0.08.
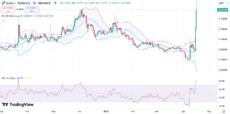
ARDR Price chart | Source: TradingView
Bollinger Bands are widely expanded, with the price currently riding well above the upper band. This signals heightened volatility and suggests that the price may soon revert toward the midline (20-day Simple Moving Average) at around $0.10 for consolidation.
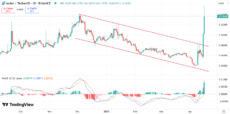
ARDR Price chart | Source: TradingView
Meanwhile, the MACD has printed a bullish crossover, with both the MACD and Signal lines surging into positive territory. This supports continued bullish bias. However, traders should watch for a flattening or divergence, which could hint at weakening momentum.
next
Disclaimer: Coinspeaker is committed to providing unbiased and transparent reporting. This article aims to deliver accurate and timely information but should not be taken as financial or investment advice. Since market conditions can change rapidly, we encourage you to verify information on your own and consult with a professional before making any decisions based on this content.

A crypto journalist with over 5 years of experience in the industry, Parth has worked with major media outlets in the crypto and finance world, gathering experience and expertise in the space after surviving bear and bull markets over the years. Parth is also an author of 4 self-published books.