

Close Menu
Altcoinvest
    What's Hot

    Bitmine Extends Ether Buying Streak to 65 Weeks

    August 31, 2026

    Altcoin Pull Back Over? Watch This Signal For Entries

    August 31, 2026

    Zakura Common Speeds Up Zcash Proofs 14x

    August 31, 2026
    Facebook X (Twitter) Instagram
    Altcoinvest
    • Bitcoin
    • Altcoins
    • Exchanges
    • Youtube
    • Crypto Wallets
    • Learn Crypto
    • bitcoinBitcoin(BTC)$78,328.00-0.52%
    • ethereumEthereum(ETH)$2,464.24-0.52%
    • tetherTether(USDT)$1.00-0.02%
    • binancecoinBNB(BNB)$688.60-1.39%
    • rippleXRP(XRP)$1.37-2.28%
    • usd-coinUSDC(USDC)$1.000.00%
    • solanaSolana(SOL)$103.13-3.08%
    • tronTRON(TRX)$0.332859-2.19%
    • Figure HelocFigure Heloc(FIGR_HELOC)$1.040.00%
    • HyperliquidHyperliquid(HYPE)$81.61-2.38%
    Altcoinvest
    Home»Crypto Wallets»Bitcoin Outlook Hinges On A Handful Of Critical Price Zones
    Bitcoin Outlook Hinges On A Handful Of Critical Price Zones
    Crypto Wallets

    Bitcoin Outlook Hinges On A Handful Of Critical Price Zones

    June 1, 2026
    Share
    Facebook Twitter LinkedIn Pinterest Email

    Bitcoin is approaching a pivotal moment, with several key support and resistance levels set to determine its next major move. While bulls are fighting to maintain critical price zones and preserve the broader recovery structure, bears continue to pressure the market from above.

    Bitcoin Struggles Below $78,080 As Bears Retain Control

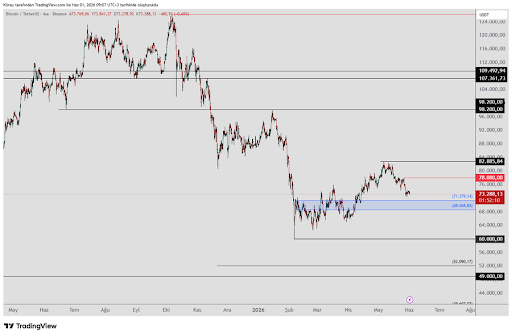
    Analyst Kamile Uray notes that Bitcoin’s recent recovery attempt was feeble, with the price remaining trapped below the critical $78,080 threshold. Until the market secures a decisive 4-hour close above this level, the structural outlook remains vulnerable, and the downward trend is likely to persist.

    Related Reading

    To the downside, attention shifts toward the Fibonacci support zone spanning $71,000 to $68,000. This region historically attracts buyers and could serve as a vital foundation for a structural rebound.
    Bitcoin
    Source: Chart from Kamile Uray on X

    Conversely, should the market turn bullish, traders must watch the $82,885 level as the primary launchpad. A successful close above this resistance opens the door to targets at $98,000, $107,000, and $109,000 that would require significant conviction to overcome.

    Examining the longer-term landscape, $126,199 represents a pivotal ceiling where corrective pressure may reemerge. Ultimately, $60,000 stands as the final defense line for the asset’s structural health. 

    $72,500 Monthly Low Becomes The Key Level To Watch

    As the new month kicks off, Lennaert Snyder identifies the $72,500 level as the critical pivot point for Bitcoin. Serving as both the Previous Monthly Low (PML) and the Previous Weekly Low (PWL), this zone dictates the immediate market bias. A decisive breakdown here would establish a strong bearish confluence, making a recovery to the previous monthly high (PMH) of $82,500 highly improbable.

    Related Reading

    Snyder’s ideal short strategy hinges on the loss of this $72,500 threshold. If the price fails to maintain this support, he anticipates a relief retest of the range, using the $78,000 Previous Weekly High (PWH) as the ceiling. This setup would provide a high-probability entry for shorts to drive the asset down to test new lows.

    However, if the market successfully defends the $72,500 PML/PWL and generates a clean bullish reaction, the focus shifts to the long side. In this scenario, Snyder intends to play the continuation of the trend, provided the market maintains its structure. He emphasizes monitoring the identified imbalances, which serve as key Points of Interest (POIs) that will help determine the validity of each move.

    While there is room for counter-trend opportunities, they require strict discipline. Snyder notes that while a bounce after a breach of the $72,500 support is technically possible, it remains a high-risk play. Consequently, he views such trades strictly as short-term scalps rather than foundational positions, preferring to align with the dominant trend once the market shows its hand.

    Bitcoin
    BTC trading at $72,856 on the 1D chart | Source: BTCUSDT on Tradingview.com

    Featured image from Getty Images, chart from Tradingview.com

    Share. Facebook Twitter Pinterest LinkedIn Tumblr Email

    Related Posts

    Bitmine Extends Ether Buying Streak to 65 Weeks

    August 31, 2026

    Crypto Jobs Estimate Shapes Senate Push

    August 31, 2026

    Bitcoin Holds $78K As Strait Of Hormuz Strike Lifts Oil Above $90

    August 31, 2026

    More Markets Lending Reserve Drained for $9.3M: Blockaid

    August 31, 2026
    Add A Comment

    Comments are closed.

    Tweets by InfoAltcoinvest

    Top Posts

    Bitmine Extends Ether Buying Streak to 65 Weeks

    August 31, 2026

    Crypto Jobs Estimate Shapes Senate Push

    August 31, 2026

    Bitcoin Holds $78K As Strait Of Hormuz Strike Lifts Oil Above $90

    August 31, 2026

    US cancels envoy trips as Iran peace deal market plummets

    April 26, 2026

    A massive $1 trillion hidden market is waiting to be unlocked in bitcoin, says new report

    May 24, 2026

    What Is Suku Crypto – Coinlabz

    December 17, 2025

    HSK is available for trading!

    January 29, 2026

    Altcoinvest is a leading platform dedicated to providing the latest news and insights on the dynamic world of cryptocurrencies.

    We're social. Connect with us:

    Facebook X (Twitter)
    Top Insights

    Bitmine Extends Ether Buying Streak to 65 Weeks

    August 31, 2026

    Altcoin Pull Back Over? Watch This Signal For Entries

    August 31, 2026

    Zakura Common Speeds Up Zcash Proofs 14x

    August 31, 2026
    Get Informed

    Subscribe to Updates

    Get the latest creative news from FooBar about art, design and business.


    Facebook X (Twitter)
    • Home
    • About us
    • Contact Us
    • Privacy Policy
    • Terms & Conditions
    © 2026 altcoinvest.com

    Type above and press Enter to search. Press Esc to cancel.