





The chart clearly shows that Shiba Inu’s long-term downtrend is continuing, making it one of the market’s weakest large-cap assets.
Bulls lost control of the only significant recovery structure on the daily timeframe, as evidenced by the recent breakdown below the rising channel that had sustained price action since March.
Before finding support, SHIB accelerated lower after the breakdown and briefly declined toward the $0.0000045 area. So far, the response from that level has been comparatively mild, indicating that buyers are intervening, but not forcefully enough to indicate a verified trend reversal.
Shiba Inu (SHIB), XRP, Dogecoin (DOGE) and Bitcoin Price Analysis for June 9: What Can Heal Cryptocurrency Market?
Ripple Joins Water.org
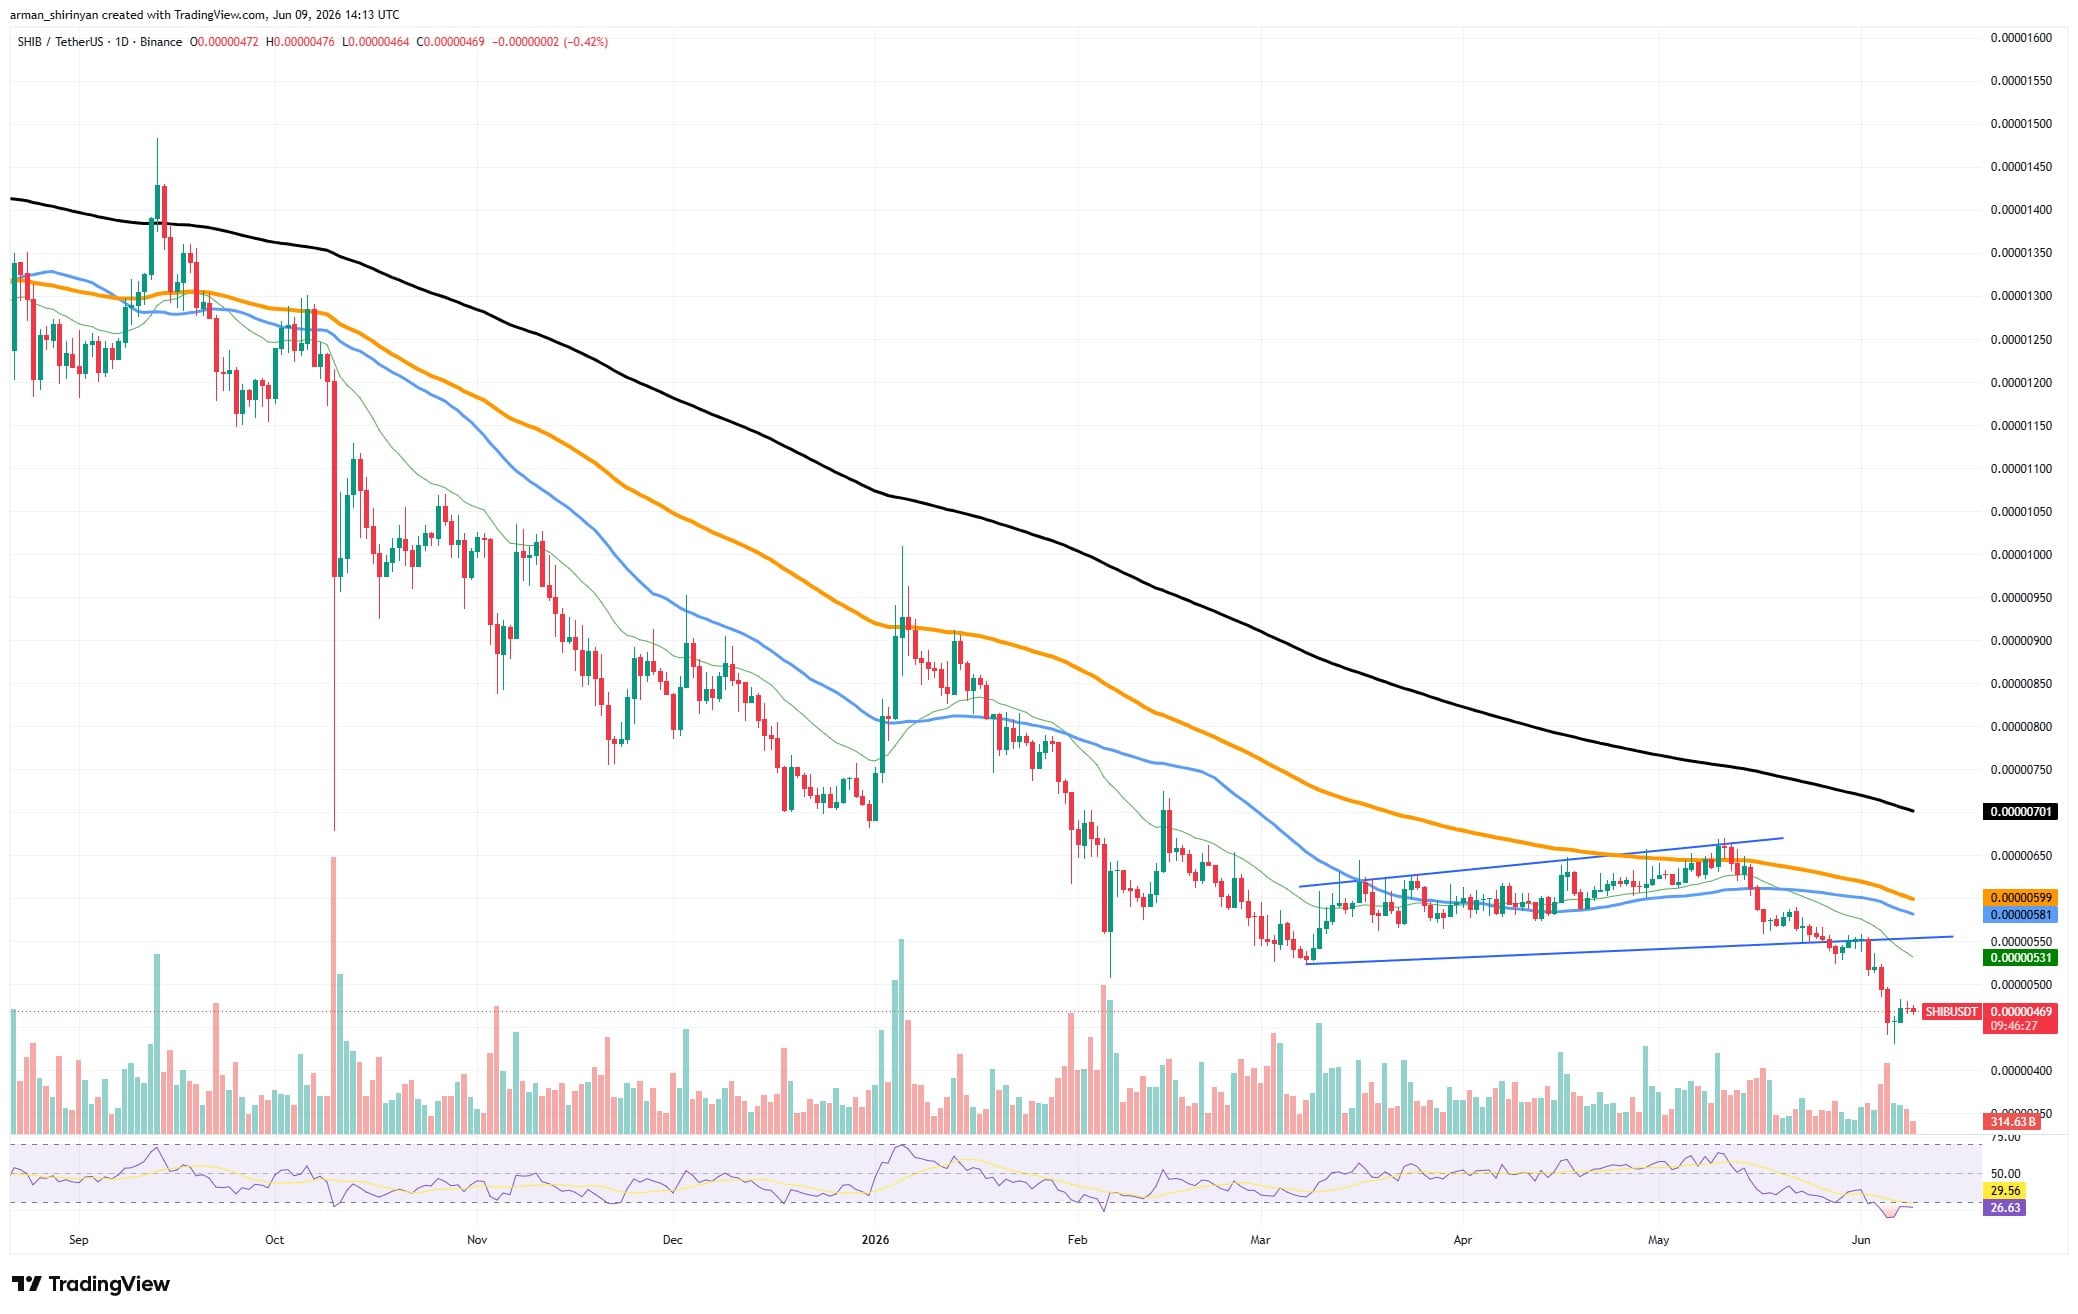
Momentum is one positive aspect. The RSI has reached the 27–30 range, indicating that it is now in oversold territory. In the past, SHIB has typically seen relief rallies when daily RSI hits such low levels. Although it is still too small to alter the general trend, the most recent bounce seems to be in line with that pattern.
The moving averages still show a negative outlook. SHIB is trading below the downward-sloping 50-, 100-, and 200-day moving averages. Until proven otherwise, this alignment usually suggests that any upward movement should be considered a countertrend rally.
A mixed signal is produced by volume. A discernible increase in activity coincided with the sell-off, indicating a surrender by weaker holders. These occurrences frequently signify the final phases of declines. However, there is less confidence in a quick recovery because the rebound itself has not drawn comparable buying volume.
The 50-day moving average, which is located close to $0.0000053, is the first resistance zone. Beyond that, a significant overhead supply area is formed by the 100-day and 200-day averages, which are roughly $0.0000058–$0.0000070.
For the time being, SHIB doesn’t seem to be establishing a confirmed bottom, but rather is starting a bottoming process. Bulls still need to recover important moving averages before the market can realistically talk about a trend reversal, even though oversold conditions favor a bounce.
The sad state of XRP
After disintegrating from a multi-month descending triangle that had been forming since March, XRP’s chart has gotten much worse. The asset swiftly moved toward the $1.10 area as a result of a wave of selling pressure brought on by the loss of support near $1.28-$1.30. Because the horizontal support had persisted for months, the breakdown was significant from a technical standpoint. The rapid decline after that level failed was probably caused by a lot of stop-loss orders and liquidations.
XRP is beginning to stabilize in spite of the weakness. After rising from the most recent low, the price is now trying to establish a base between $1.15 and $1.18. The RSI has entered oversold territory, much like SHIB, suggesting that bearish momentum may be coming to an end.
You Might Also Like

Bulls face a problem because XRP is still below all of the major moving averages. These days, layered resistance levels are the 50-day average at $1.27, the 100-day average at $1.35, and the 200-day average at $1.40. XRP will encounter significant selling pressure as it approaches these zones, even if a relief rally takes place.
The behavior of volume is notable. The breakdown caused one of the biggest volume spikes in months, suggesting that the sell-off was widely participated in by the market. Such spikes do not always indicate the final bottom, even though they may indicate capitulation. Following these occurrences, markets frequently need a period of consolidation.
Monitoring the former support area, which is located between $1.28 and $1.30, is crucial. The breakdown might turn out to be a bear trap if XRP is able to regain that area. The asset would be exposed to another test of recent lows if this wasn’t done.
XRP appears to be oversold and technically stretched right now, which could lead to a brief recovery. But until the price can rise above the main moving averages and recover the support it recently lost, the overall trend is still negative.
Dogecoin sellers are weaker
Dogecoin is currently in a similar situation to many other large-cap altcoins: the market has finally reached a point where sellers may be running out of steam, but the trend is still bearish.
The loss of the rising trendline that had been supporting DOGE since February is the largest technical development on the chart. The sell-off quickened after that trendline broke, driving the asset below several significant moving averages. Eventually, the price dropped to the $0.085 area, where buyers started to show up.
You Might Also Like

The good news for bulls is that DOGE is currently extremely oversold. Before beginning to rise again, the RSI briefly fell below 30. When momentum gets this stretched, Dogecoin has historically produced strong relief rallies. It’s a different matter entirely whether those rallies turn into real trend reversals.
Attention should also be paid to volume. A noticeable increase in trading activity coincided with the recent decline, indicating some capitulation. That type of panic selling is typically necessary for markets to reach a significant bottom.
However, the technical framework is still inadequate. DOGE is still below the 50-day, 100-day, and 200-day moving averages. The current immediate resistance is represented by the 50-day average around $0.096 and the 100-day average around $0.102. Any attempt at recovery will probably encounter sellers at those levels.
The realistic outlook is quite straightforward: given the oversold conditions, DOGE most likely has enough room for a brief rebound. However, the general downward trend persists until it reclaims the $0.10-$0.102 region. Instead of getting ready for a significant breakout, the market currently appears to be attempting to stop declining.
Bitcoin’s crisis is behind
Although Bitcoin’s chart appears unfavorable, there are finally indications that the worst of the panic might be behind us.
A violent sell-off that erased months’ worth of gains in a matter of sessions was brought on by the recent breakdown below the March-May trendline. Bitcoin experienced one of the biggest liquidation events of the year as it dropped from over $80,000 to almost $60,000.
Volume is the first feature that is noticeable. The decline toward $60,000 coincided with a sharp increase in trading activity, which typically indicates simultaneous forced sales, liquidations, and panic exits. This type of flush is frequently required before a significant recovery can start.
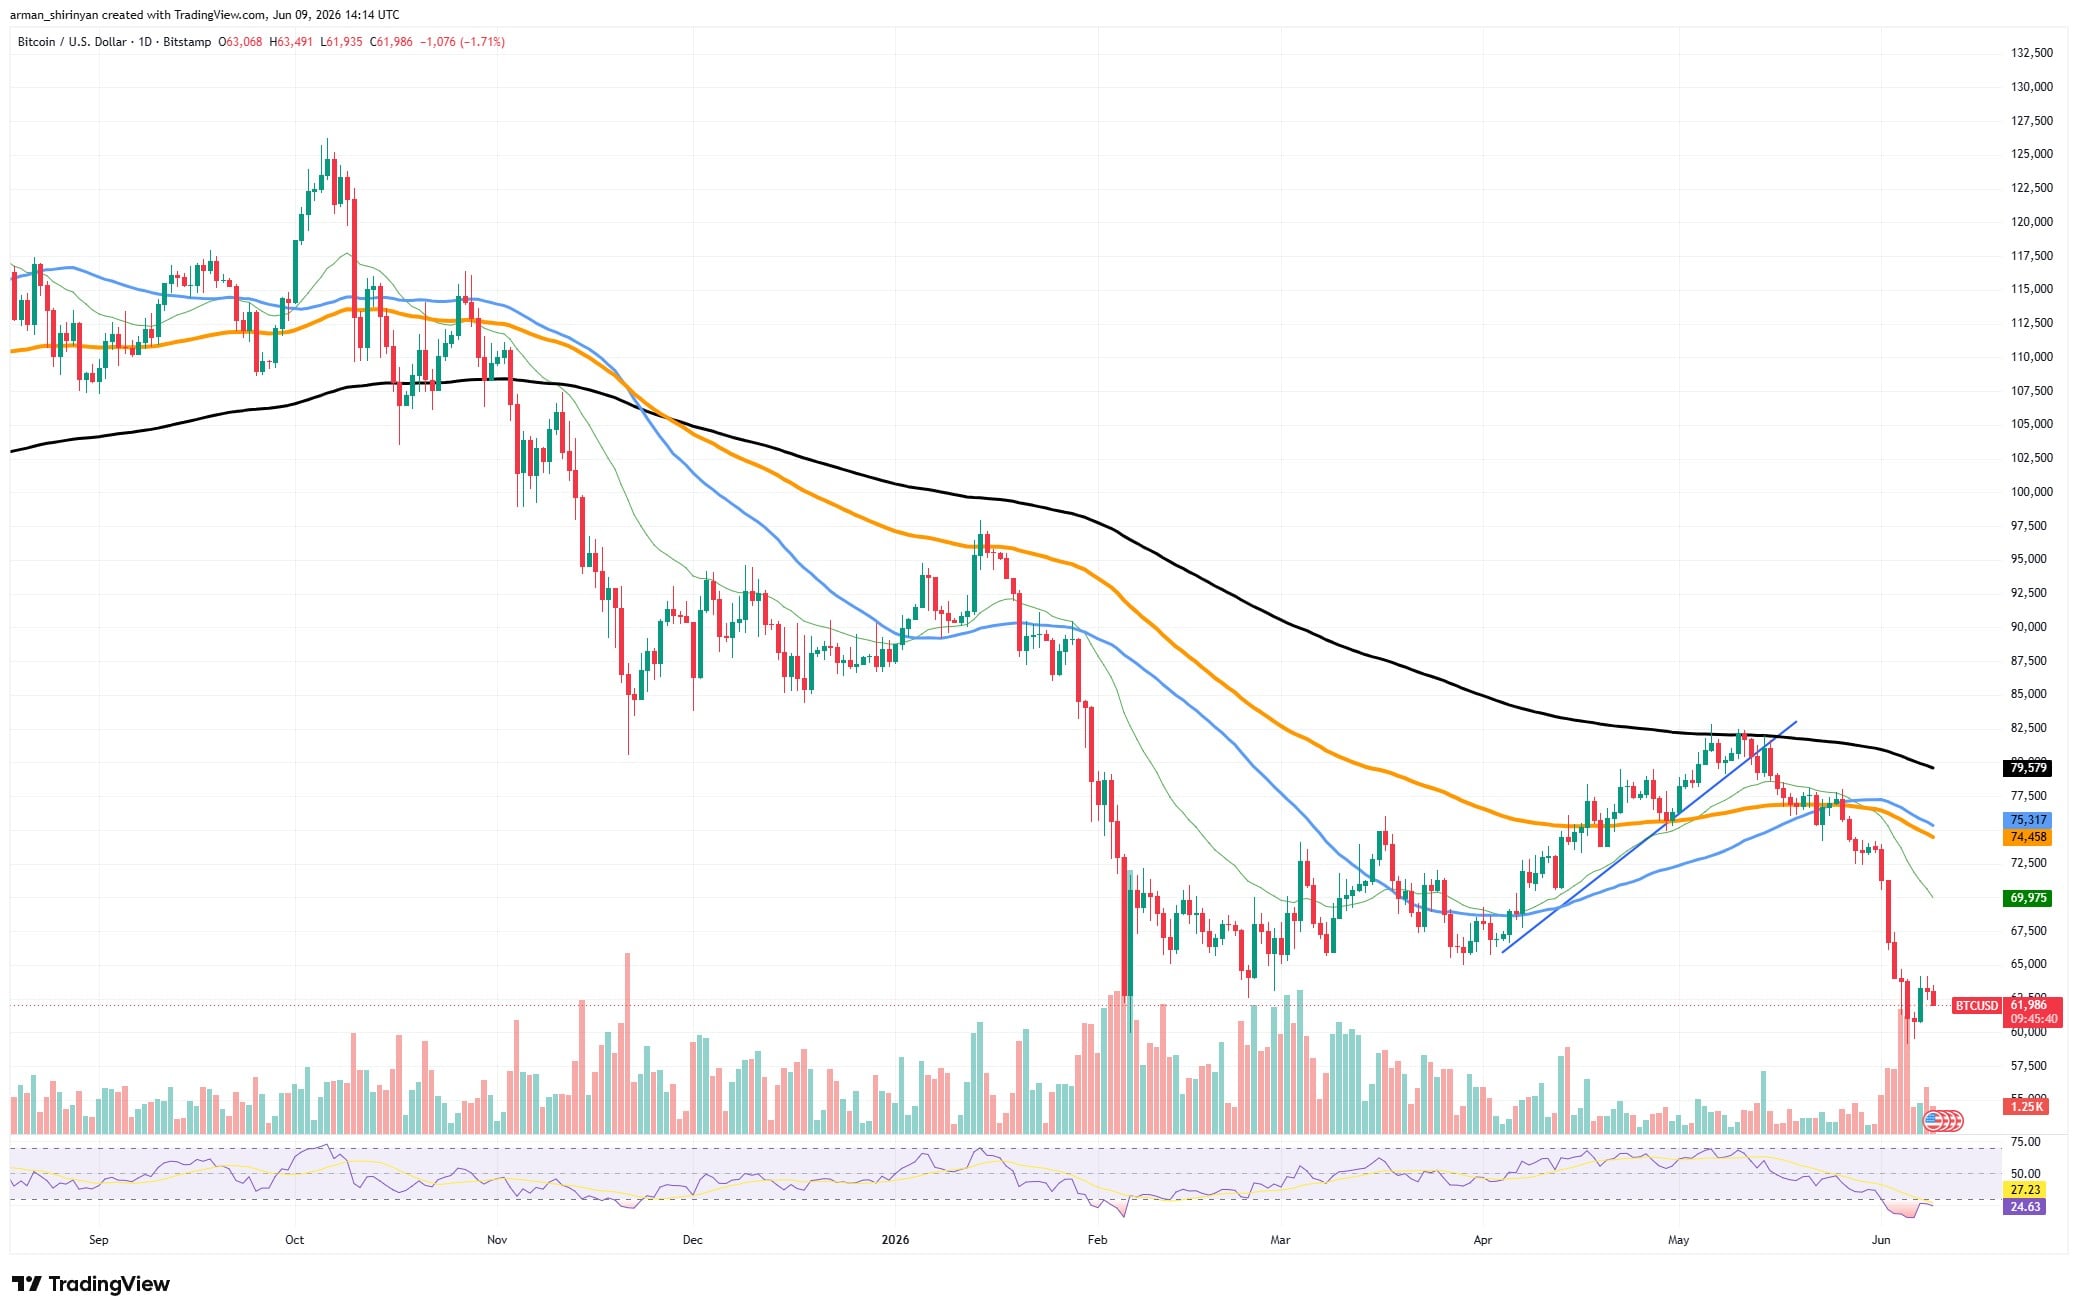
This is also the case with momentum indicators. The daily RSI fell into the mid-20s, a region that Bitcoin rarely enters. Every time Bitcoin hits these levels, traders begin searching for a relief rally at the very least.
The trend itself is still bearish, which is the issue. At the moment, Bitcoin is below the 50-, 100-, and 200-day moving averages. The first significant challenge is now the 50-day average of about $70,000. The $74,000-$75,000 range is the next obstacle after that.
The good news is that following the initial decline, Bitcoin has been able to stabilize between $62,000 and $63,000. Compared to the breakdown phase, sellers no longer seem to be as aggressive.
For the time being, it appears that the market is attempting to establish a floor following a capitulation event rather than the beginning of a new bull run. It wouldn’t be shocking if there was a return to the moving averages. Whether this is just a relief rally or the start of a more significant recovery will depend on whether buyers are able to push past them.