Close Menu
Altcoinvest
    What's Hot

    BITCOIN: $3 BILLION READY to BUY NOW!!🚨WARNING: $480 MILLION TETHER MINTED!!!

    July 5, 2026

    Bitcoin to $53K? Exchange Deposits Jump as Analysts Warn of Increased Volatility

    July 5, 2026

    Strategy CEO Compares Firm to Amazon and Tesla, Says Crises Define Great Companies ⋆ ZyCrypto

    July 5, 2026
    Facebook X (Twitter) Instagram
    Altcoinvest
    • Bitcoin
    • Altcoins
    • Exchanges
    • Youtube
    • Crypto Wallets
    • Learn Crypto
    • bitcoinBitcoin(BTC)$62,713.000.43%
    • ethereumEthereum(ETH)$1,762.510.54%
    • tetherTether(USDT)$1.000.00%
    • binancecoinBNB(BNB)$571.400.33%
    • usd-coinUSDC(USDC)$1.00-0.01%
    • rippleXRP(XRP)$1.14-0.01%
    • solanaSolana(SOL)$80.49-2.56%
    • tronTRON(TRX)$0.3247950.61%
    • Figure HelocFigure Heloc(FIGR_HELOC)$1.010.00%
    • HyperliquidHyperliquid(HYPE)$68.57-3.69%
    Altcoinvest
    Home»Altcoins»Three XRP Setups Signaling a Potential Price Dip Under $1 in June
    Three XRP Setups Signaling a Potential Price Dip Under  in June
    Altcoins

    Three XRP Setups Signaling a Potential Price Dip Under $1 in June

    June 12, 2026
    Share
    Facebook Twitter LinkedIn Pinterest Email

    XRP (XRP) charts are painting multiple bearish patterns this month with a downside target under $1.

    Key takeaways:

    • XRP is forming head-and-shoulders and bear flag setups on its shorter-time frame chart.
    • An on-chain metric is further signaling weak demand or capitulation sentiment among traders.

    Head-and-shoulders setup hints at 10% XRP decline

    Since June 5, the XRP price has formed what appears to be a head-and-shoulders (H&S) pattern.

    The setup develops when the price forms three peaks atop a common neckline support, where the middle peak, called the “head,” is higher than the other two, the “shoulders.”

    An H&S pattern typically resolves when the price breaks decisively below the neckline support, with its downside target measured by subtracting the breakdown level from the structure’s maximum height.

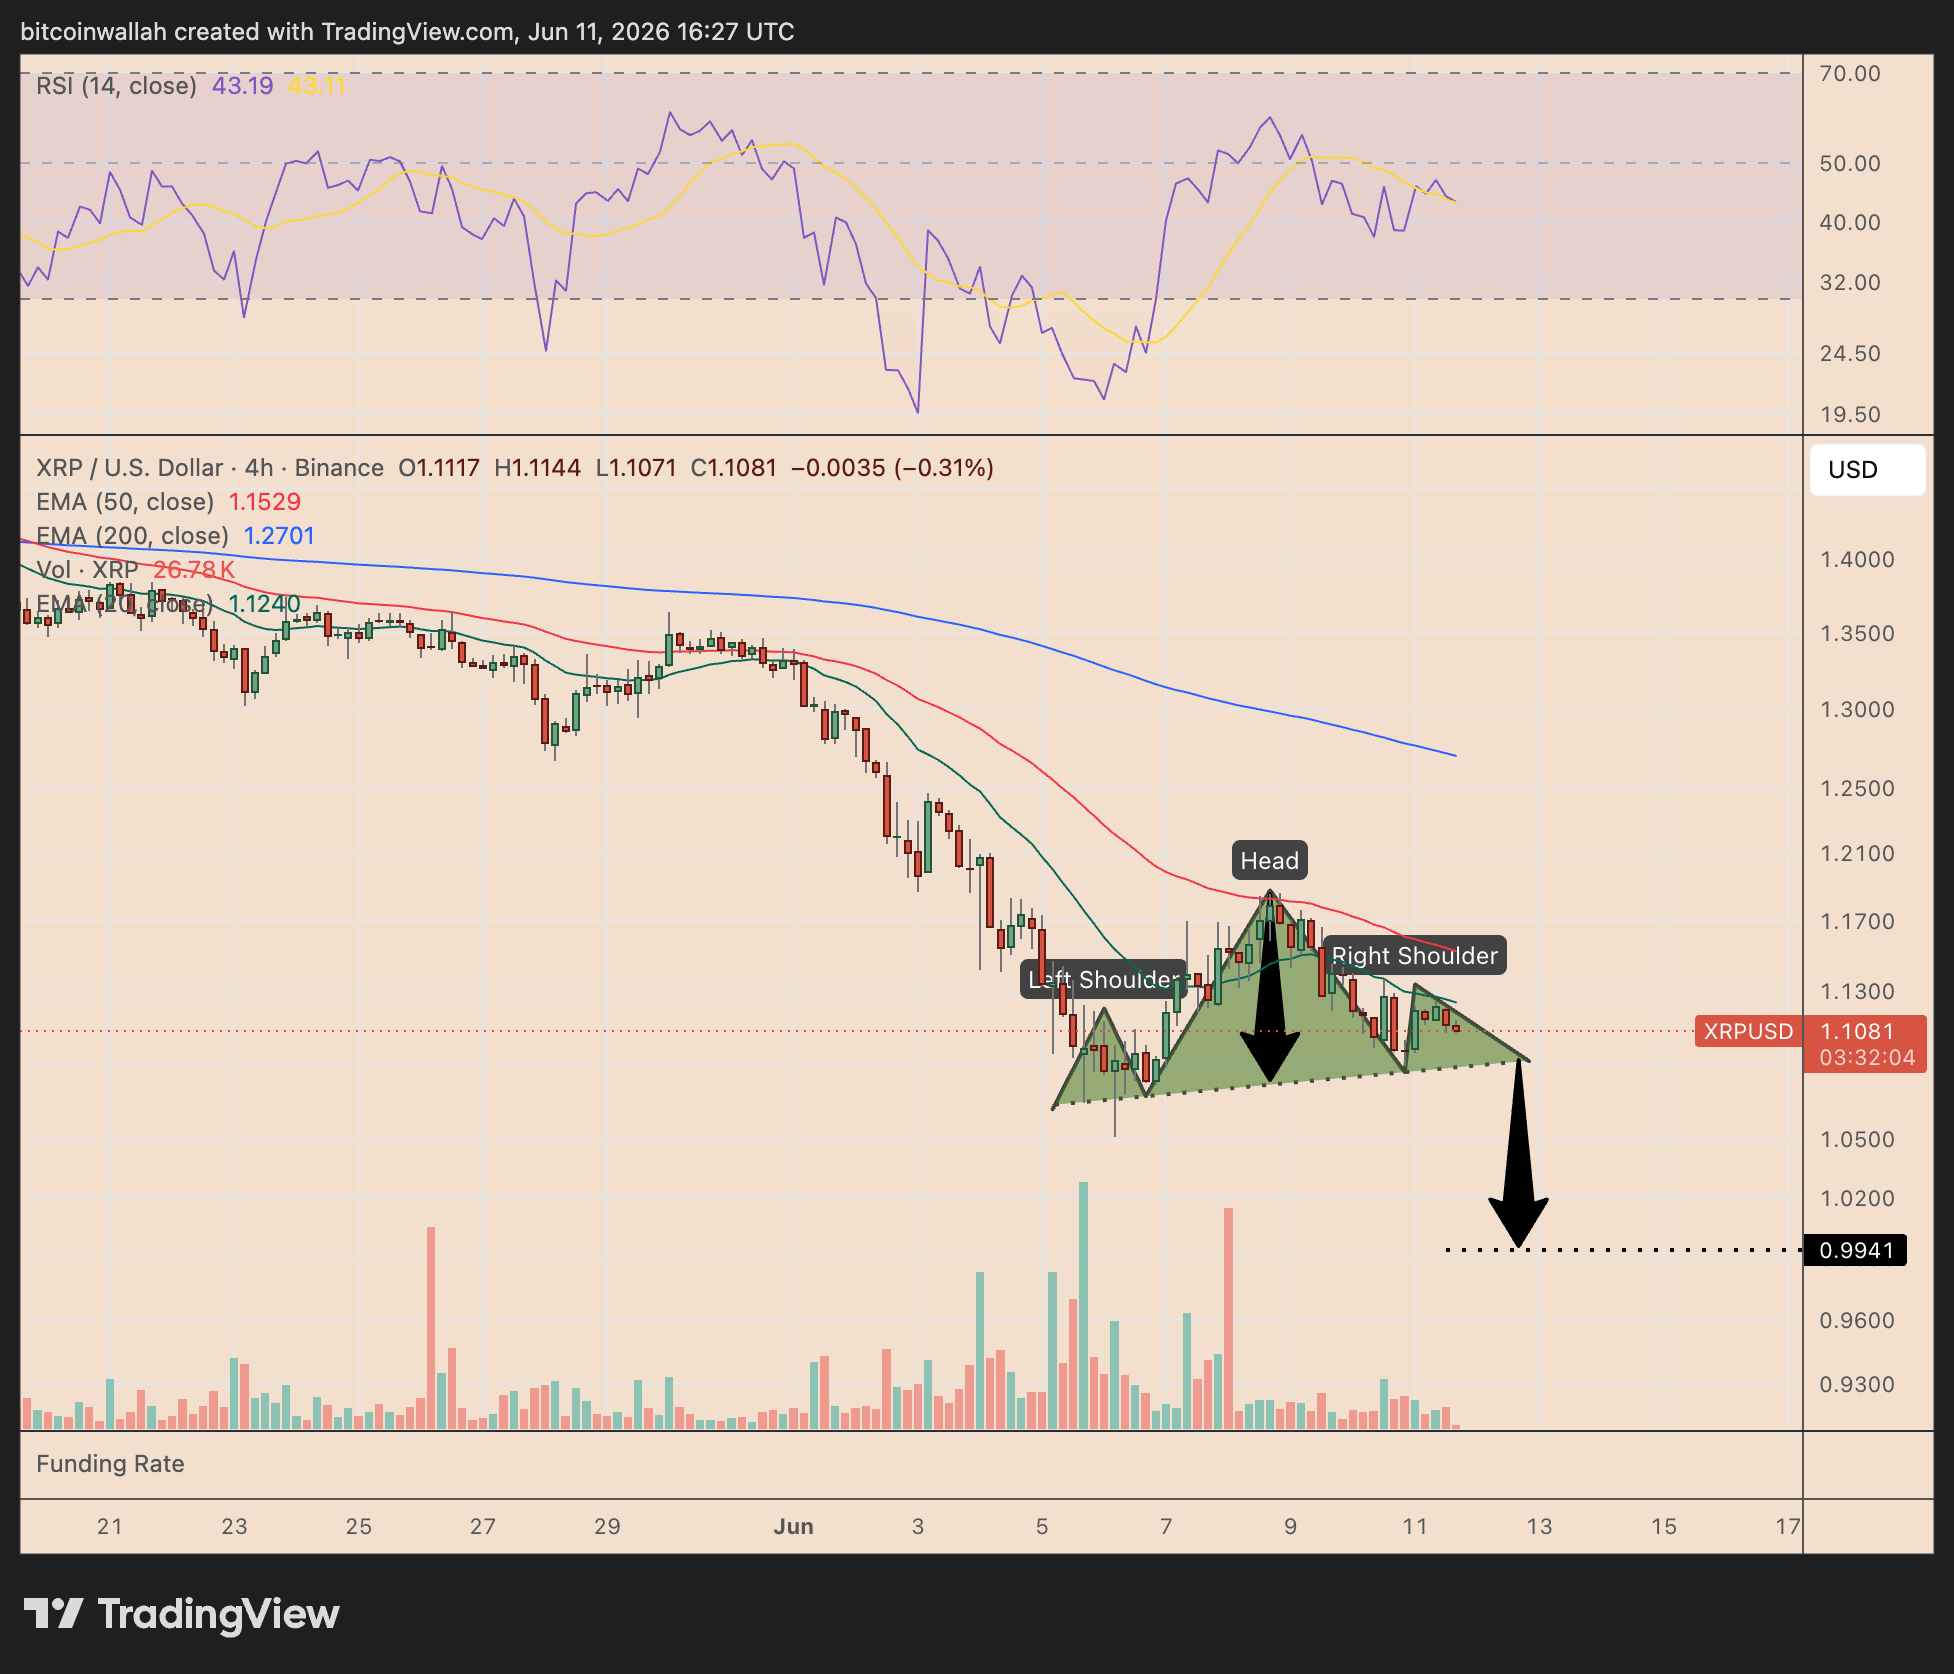
    XRP/USD four-hour price chart. Source: TradingView

    As of Thursday, XRP was forming the pattern’s right shoulder, eyeing an initial dip toward the neckline near $1.09.

    Applying the technical rule, the target for June is around $0.99, down roughly 10%, if the price breaks below the neckline.

    Conversely, a clear break above the right shoulder’s peak at around $1.12, a level also aligning with the 20-period exponential moving average (20-period EMA, green) on the four-hour chart, may invalidate the H&S pattern.

    In that case, XRP may rally toward the 50-period EMA (red) near $1.15, up 4.5% from the current price levels.

    Another bearish setup hints at a lower XRP price target

    XRP’s four-hour chart also shows a bear flag, adding weight to the sub-$1 bearish outlook.

    A bear flag forms when the price consolidates inside a rising channel after a sharp sell-off. It typically signals a pause before the prior downtrend resumes.

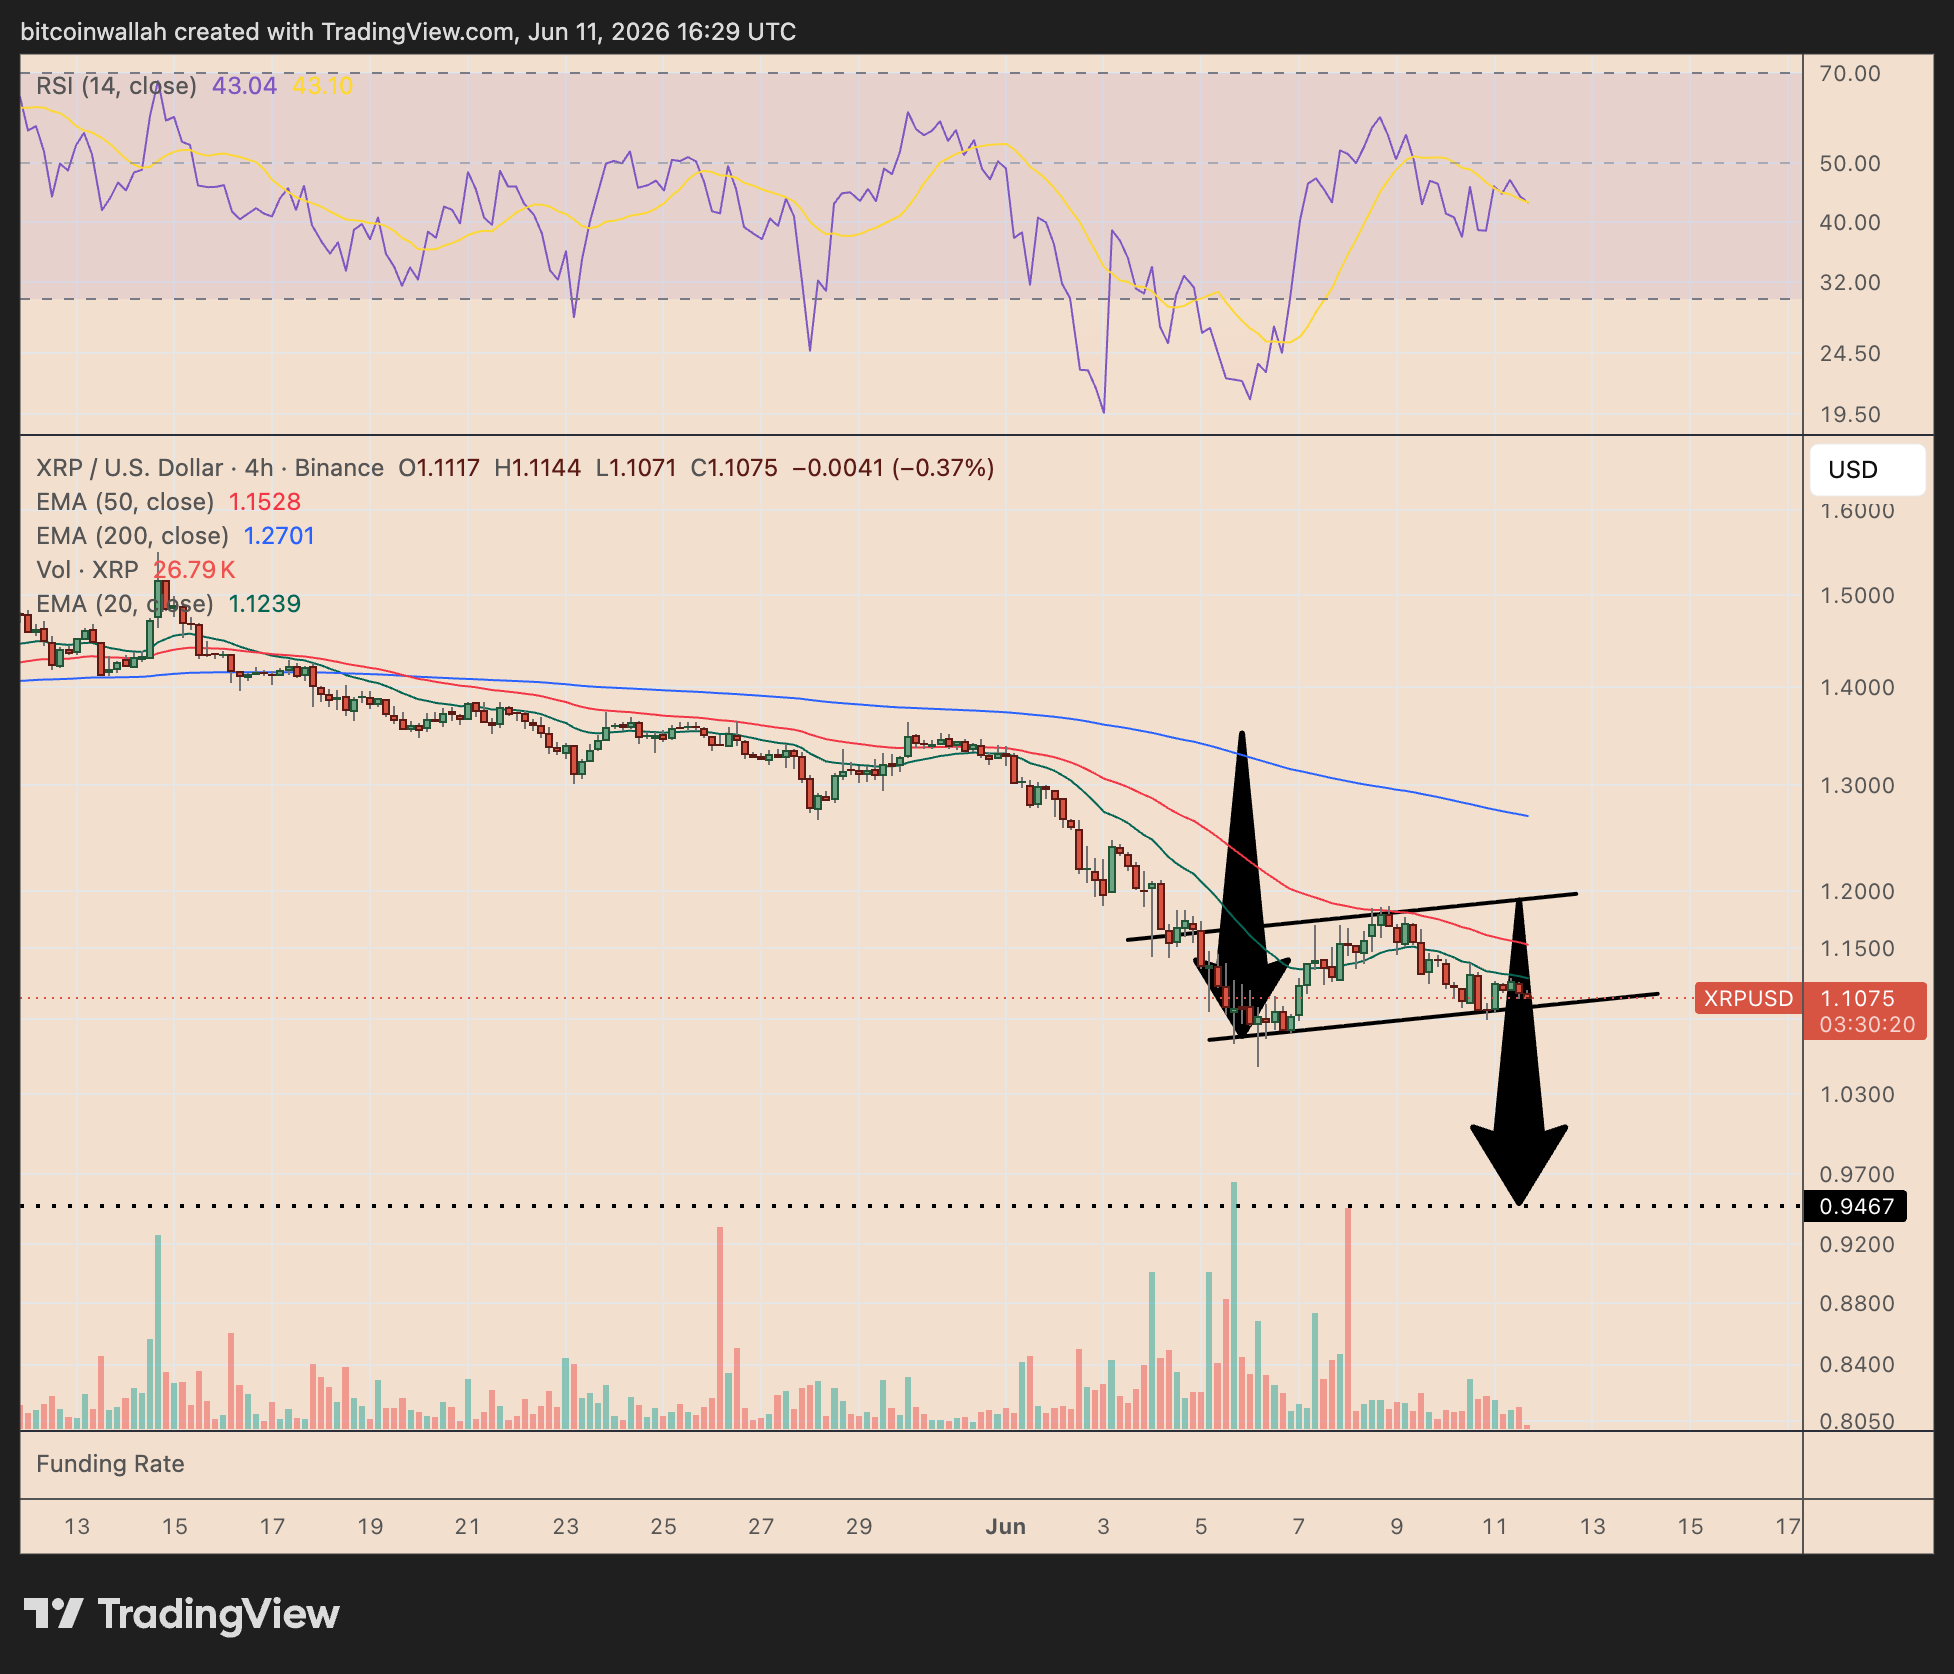
    XRP/USD four-hour chart. Source: TradingView

    As of Thursday, XRP was testing the flag’s lower trendline near $1.10. A decisive four-hour close below this level could confirm the breakdown.

    Applying the technical rule, XRP’s bear flag target sits near $0.94, down roughly 15% from current prices.

    The relative strength index (RSI) near 43 supports the bearish view, showing weak momentum below the neutral 50 level.

    However, a rebound above $1.12 would weaken the setup. A stronger move above the 50-period EMA near $1.15 could delay the selloff and send XRP toward the flag’s upper trend line near $1.18–$1.20.

    On-chain data points to dip toward $0.96

    XRP’s MVRV pricing bands suggest the price still has room to fall toward the lower green zone.

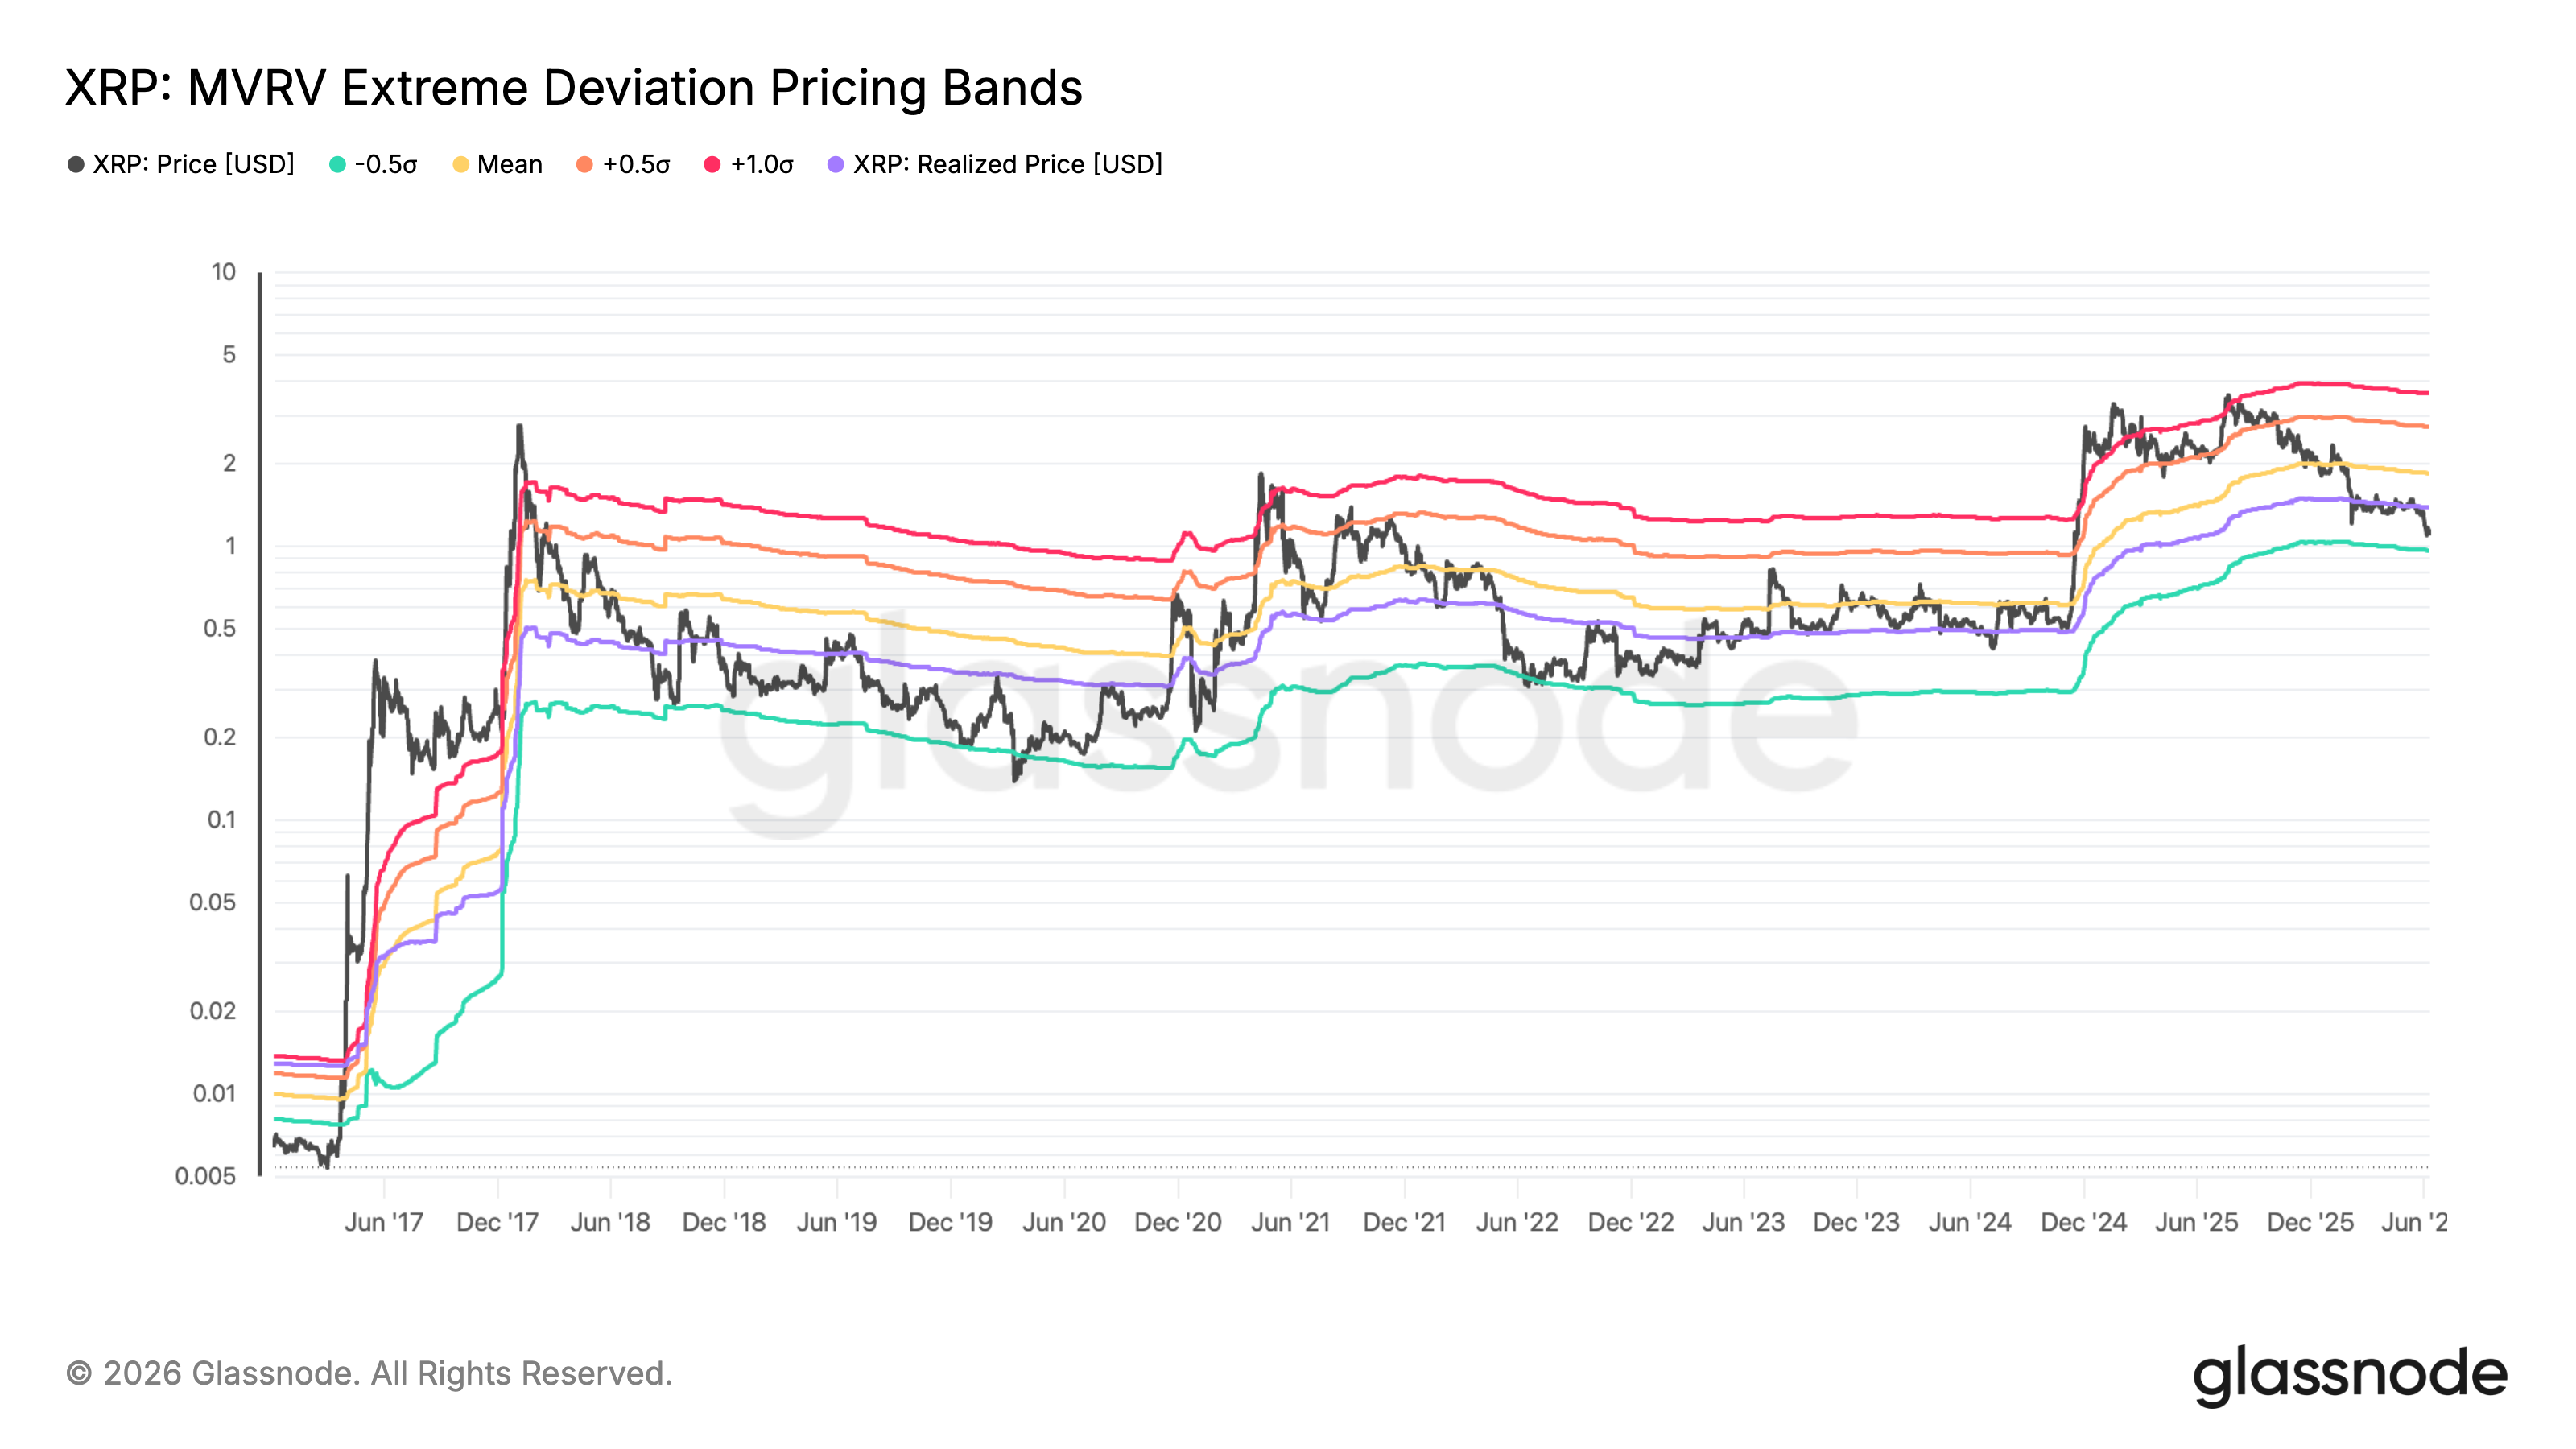
    XRP MVRV extreme deviation pricing bands. Source: Glassnode

    For new traders, MVRV compares XRP’s market price with the average price at which coins last moved on-chain. In simple terms, it shows whether holders are sitting on large paper profits or losses.

    When price trades near the upper bands, the market is usually overheated. When it falls toward the lower bands, it often signals stress, weak demand, or capitulation.

    Related: XRP transaction demand falls 91.5% as traders focus on $0.65 support

    That lower green band has acted like a bear-market magnet for XRP in previous cycles. It declined toward or below the same zone during major downturns in 2018, 2020 and 2022 before finding stronger support later.

    The next major downside target sits near the green lower band near $0.96, about 13% below current prices if history repeats.

    Share. Facebook Twitter Pinterest LinkedIn Tumblr Email

    Related Posts

    Bitcoin to $53K? Exchange Deposits Jump as Analysts Warn of Increased Volatility

    July 5, 2026

    56 Million Emails Compromised and 124 Million Passwords Exposed in Massive Malware Theft – Here’s How To See If You’re Affected

    July 5, 2026

    Bitcoin Traders Watch Macro Signals As Kraken Flags Policy Uncertainty

    July 5, 2026

    Whales bought $16.7B of Bitcoin as ETFs bled a record $4B

    July 5, 2026
    Add A Comment

    Comments are closed.

    Tweets by InfoAltcoinvest

    Top Posts

    Bitcoin to $53K? Exchange Deposits Jump as Analysts Warn of Increased Volatility

    July 5, 2026

    56 Million Emails Compromised and 124 Million Passwords Exposed in Massive Malware Theft – Here’s How To See If You’re Affected

    July 5, 2026

    Bitcoin Traders Watch Macro Signals As Kraken Flags Policy Uncertainty

    July 5, 2026

    XRP ETF Demand Returns? Ripple Funds Hit 2-Month Inflow High

    April 11, 2026

    VET DAILY ANALYSIS – VECHAIN VET PRICE PREDICTION – VECHAIN VET 2025 – VECHAIN ANALYSIS

    December 1, 2025

    Solana Meme Coin Surges 6,000% After Creators Arrested Over ‘Rug Pull’

    May 27, 2026

    Bitcoin Price Hovers Around $60K: Peter Schiff Blames Saylor

    June 26, 2026

    Altcoinvest is a leading platform dedicated to providing the latest news and insights on the dynamic world of cryptocurrencies.

    We're social. Connect with us:

    Facebook X (Twitter)
    Top Insights

    BITCOIN: $3 BILLION READY to BUY NOW!!🚨WARNING: $480 MILLION TETHER MINTED!!!

    July 5, 2026

    Bitcoin to $53K? Exchange Deposits Jump as Analysts Warn of Increased Volatility

    July 5, 2026

    Strategy CEO Compares Firm to Amazon and Tesla, Says Crises Define Great Companies ⋆ ZyCrypto

    July 5, 2026
    Get Informed

    Subscribe to Updates

    Get the latest creative news from FooBar about art, design and business.


    Facebook X (Twitter)
    • Home
    • About us
    • Contact Us
    • Privacy Policy
    • Terms & Conditions
    © 2026 altcoinvest.com

    Type above and press Enter to search. Press Esc to cancel.