

Close Menu
Altcoinvest
    What's Hot

    Google Maps Switches Lake Ontario to Lake America for U.S. Users After Trump Order

    August 31, 2026

    MSCI Index Review Could Pressure Shares

    August 31, 2026

    Bitcoin’s New Quantum Defenses, 18.9M SOL Cancelled: Hodler’s Digest

    August 31, 2026
    Facebook X (Twitter) Instagram
    Altcoinvest
    • Bitcoin
    • Altcoins
    • Exchanges
    • Youtube
    • Crypto Wallets
    • Learn Crypto
    • bitcoinBitcoin(BTC)$77,915.00-0.38%
    • ethereumEthereum(ETH)$2,428.70-1.35%
    • tetherTether(USDT)$1.00-0.01%
    • binancecoinBNB(BNB)$686.44-0.92%
    • rippleXRP(XRP)$1.36-2.36%
    • usd-coinUSDC(USDC)$1.00-0.01%
    • solanaSolana(SOL)$102.24-3.01%
    • tronTRON(TRX)$0.335696-1.45%
    • Figure HelocFigure Heloc(FIGR_HELOC)$1.000.00%
    • HyperliquidHyperliquid(HYPE)$80.53-3.19%
    Altcoinvest
    Home»Altcoins»ZEC retakes $500 – These 2 zones decide what comes next for Zcash
    ZEC retakes 0 – These 2 zones decide what comes next for Zcash
    Altcoins

    ZEC retakes $500 – These 2 zones decide what comes next for Zcash

    August 8, 2026
    Share
    Facebook Twitter LinkedIn Pinterest Email

    ZCash [ZEC] was trading above the $500 level once again. Since forming a local low at $451 on Wednesday, the 29th of July, ZEC has steadily climbed higher. The privacy token was up 12.48% over the past week.

    These gains have thrust the ZCash token price back above the hotly contested $500 area. Its importance stretched back to December 2025, when a rejection from this psychological round-number resistance saw a pullback to $176.
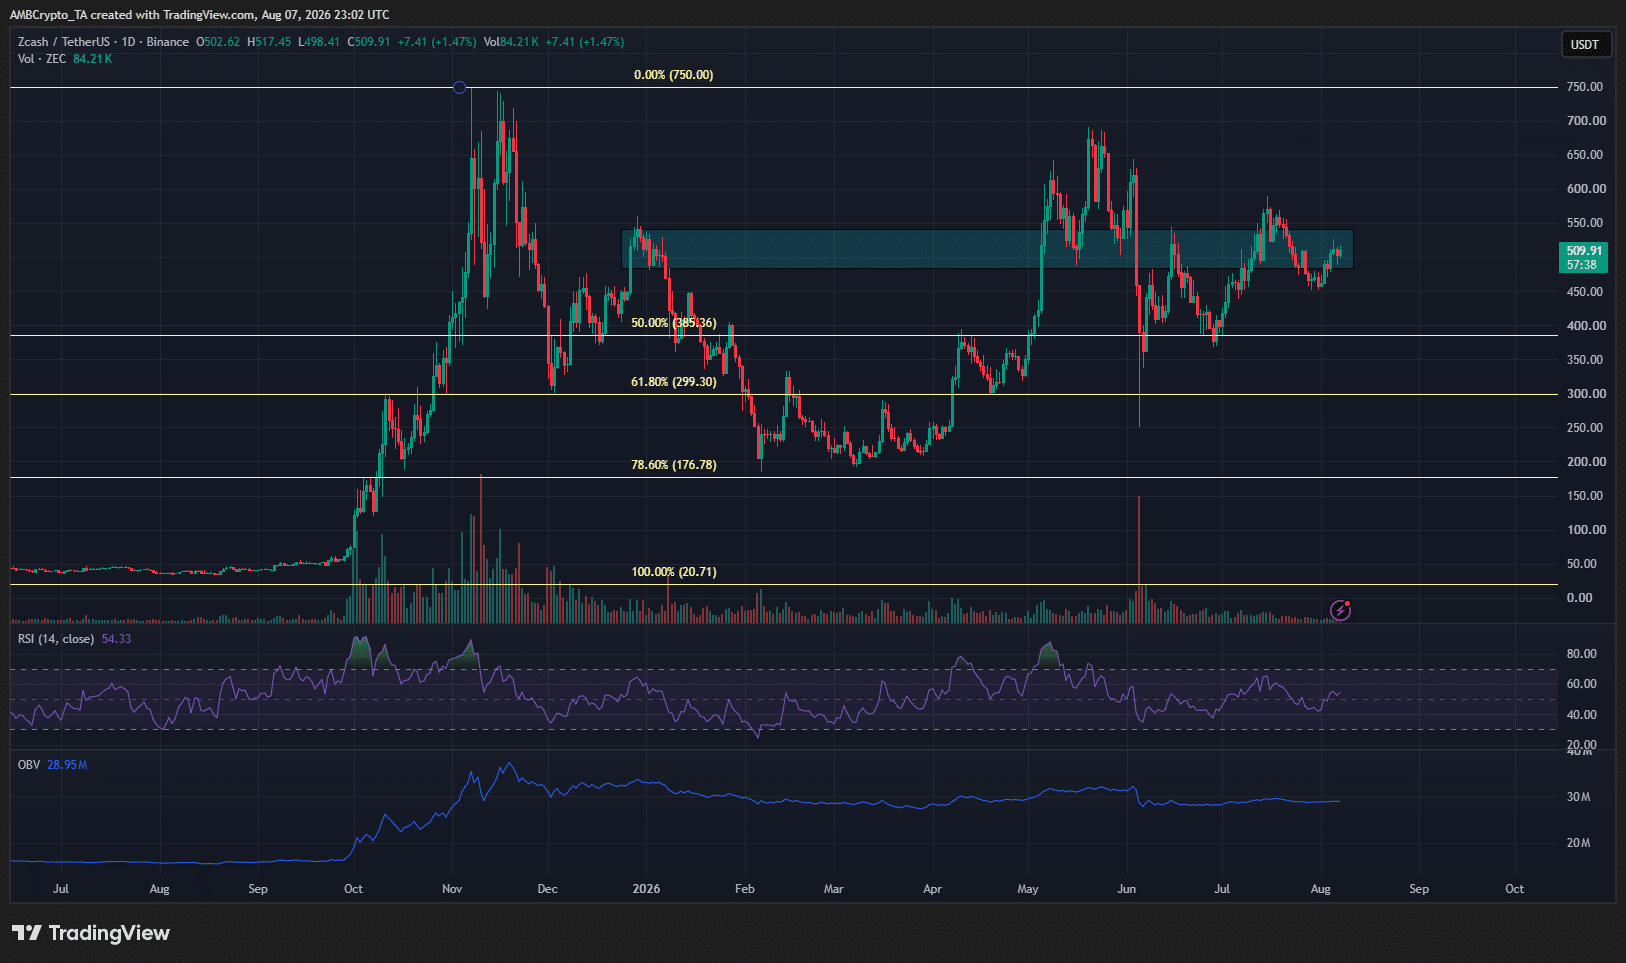
    ZCash 1-day ChartZCash 1-day Chart
    Source: ZEC/USDT on TradingView

    The higher timeframe trend was bullish after the rally to $750 in 2025. The deep pullback since then can be regarded as part of the uptrend. This view is reinforced by the bullish reaction from the $176 level, which is the 78.6% Fibonacci retracement level, in March 2026.
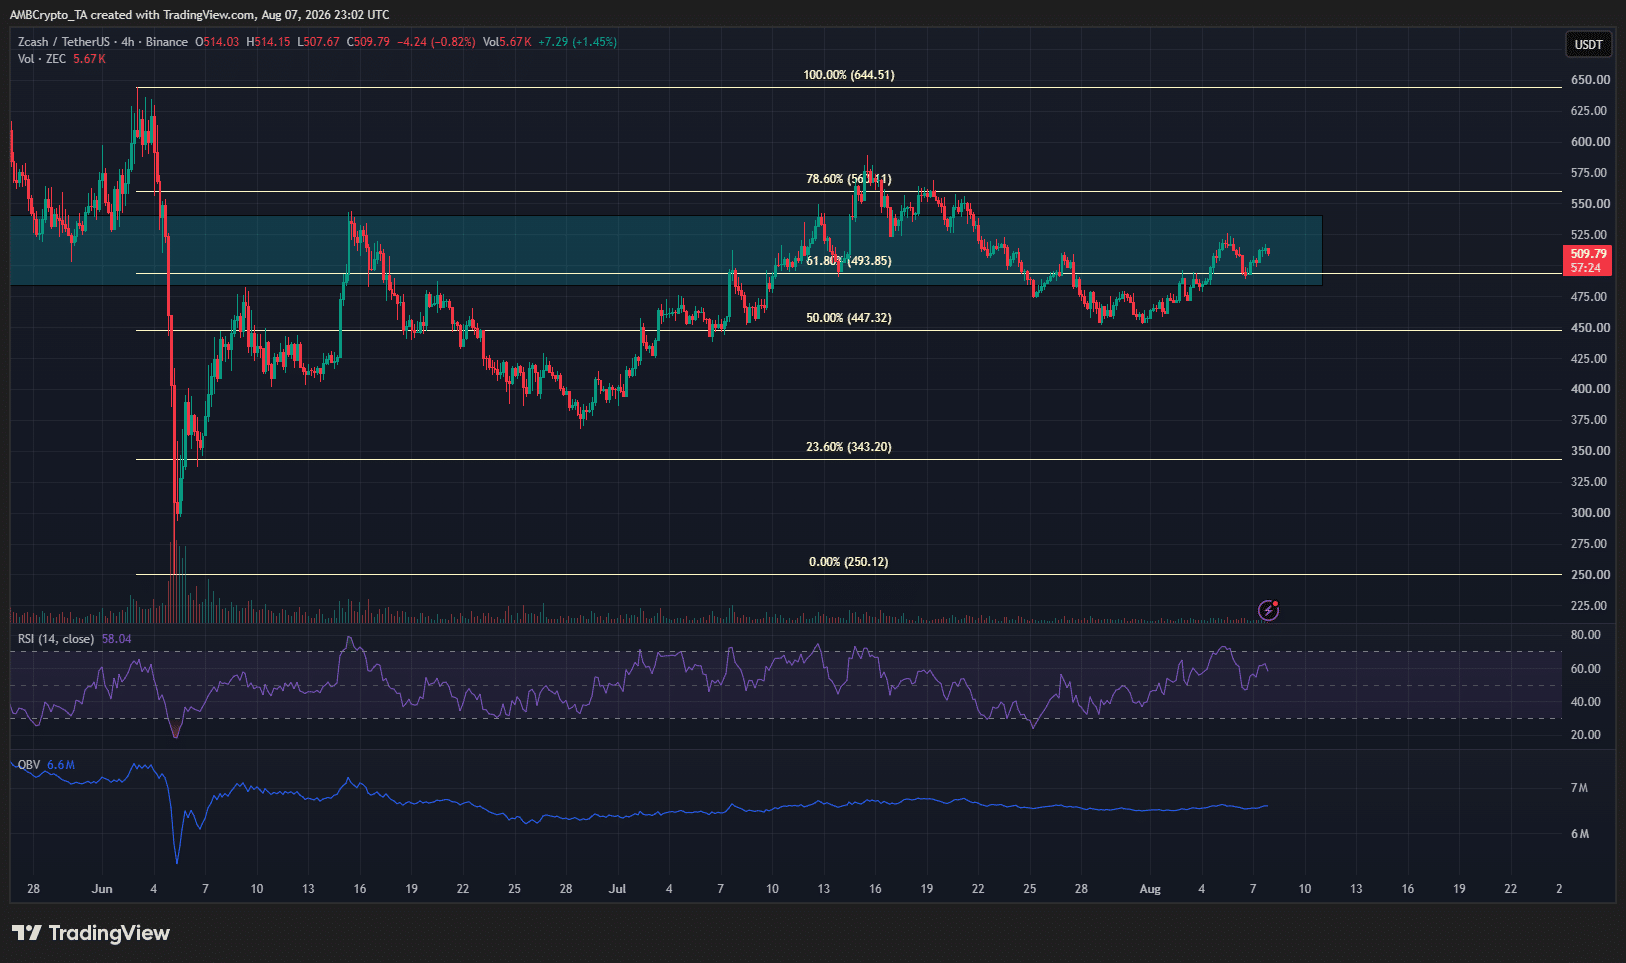
    ZCash 4-hour ChartZCash 4-hour Chart
    Source: ZEC/USDT on TradingView

    Towards the end of July, ZEC began to fall below the $500 area. Moreover, it aligned with the bearish 4-hour timeframe structure. Based on this, as well as Bitcoin’s [BTC] inability to climb above $67.3k, a bearish short-term move was expected for ZCash.

    The 1-day was bullish, the push above $500 seems like a signal, but the H4 structure is bearish. The OBV on either timeframe has been flat in recent weeks, a sign of equilibrium between buyers and sellers.

    What should ZEC traders expect next?

    The $360-$377 area has been highlighted as a key support in a recent report. A lack of firm momentum in either direction was also noted. The Ironwood upgrade, activated on the 28th of July, might have reinstated confidence in the network, but not enough to attract strong capital inflows.
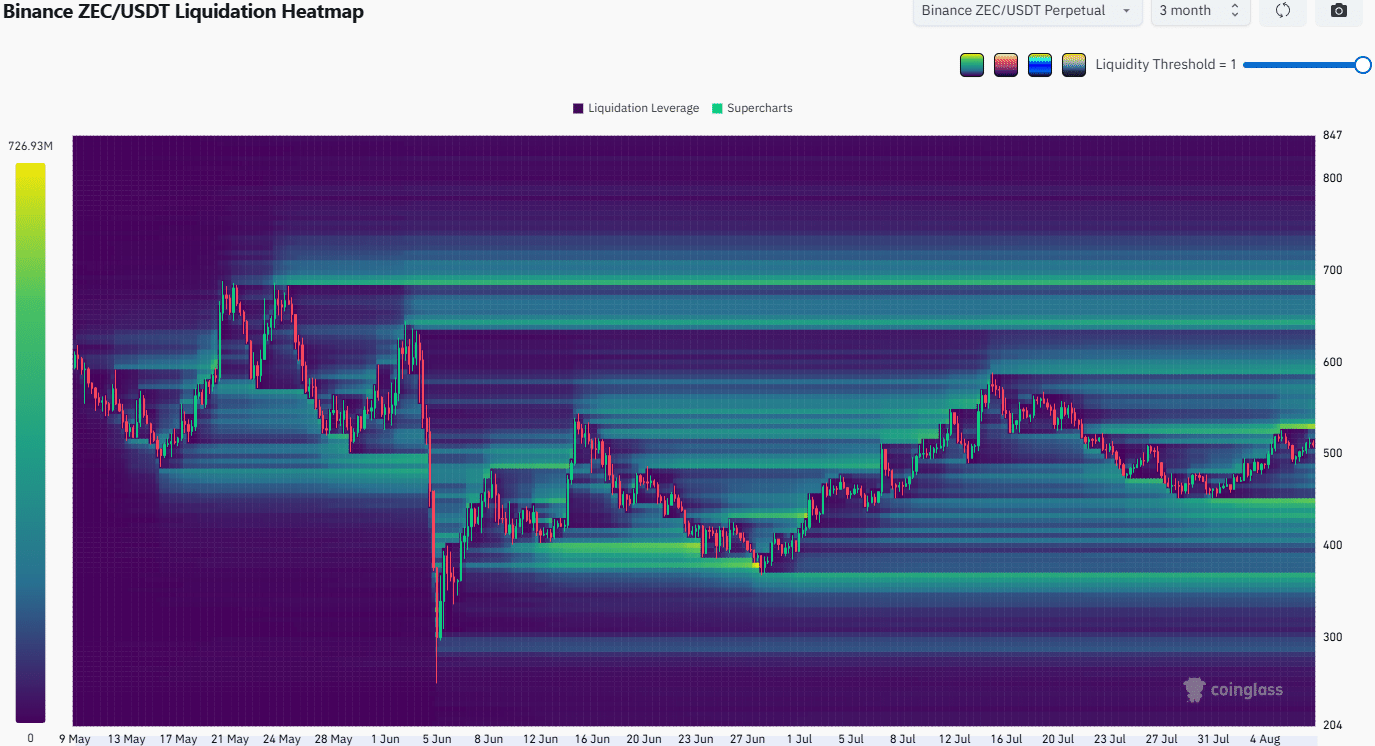
    ZCash Liquidation HeatmapZCash Liquidation Heatmap
    Source: ZEC/USDT on TradingView

    The price action in recent weeks was likely influenced more by liquidation clusters, also known as magnetic zones, than aggressive spot trading volumes.

    The ZEC price reaction from $367 in late June and $590 in mid-July helps make this point.

    If this trend continues, the two key nearby magnetic zones to monitor will be $530 and $450. Hence, swing traders can wait for a sweep of these regions to enter, anticipating a reversal toward the magnetic zone in the opposite direction.


    Final Summary

    • ZCash has made strong gains over the past week and was once more trading above $500.
    • Analysis of the liquidation heatmap, combined with the lack of significant movement on volume indicators, suggested liquidity pockets might be driving short-term price trends.
    Share. Facebook Twitter Pinterest LinkedIn Tumblr Email

    Related Posts

    Google Maps Switches Lake Ontario to Lake America for U.S. Users After Trump Order

    August 31, 2026

    PEPE And WLFI Lead Altcoin Volatility As Market Rotates Again

    August 30, 2026

    Stablecoin card spending crosses $10.9B

    August 30, 2026

    Uniswap liquidity surges 87% – Can UNI price break its 4-month range?

    August 30, 2026
    Add A Comment

    Comments are closed.

    Tweets by InfoAltcoinvest

    Top Posts

    Google Maps Switches Lake Ontario to Lake America for U.S. Users After Trump Order

    August 31, 2026

    PEPE And WLFI Lead Altcoin Volatility As Market Rotates Again

    August 30, 2026

    Stablecoin card spending crosses $10.9B

    August 30, 2026

    The Harsh Truth About How Hostile The Moon Really Is

    May 4, 2026

    Crypto already owns the trade

    July 5, 2026

    Bitcoin briefly reclaims $82,000 on Gate as volatility stays muted

    May 11, 2026

    Ambiq Micro (AMBQ) Stock Soars 30% on Strong Q1 Earnings Driven by Edge AI Growth

    May 12, 2026

    Altcoinvest is a leading platform dedicated to providing the latest news and insights on the dynamic world of cryptocurrencies.

    We're social. Connect with us:

    Facebook X (Twitter)
    Top Insights

    Google Maps Switches Lake Ontario to Lake America for U.S. Users After Trump Order

    August 31, 2026

    MSCI Index Review Could Pressure Shares

    August 31, 2026

    Bitcoin’s New Quantum Defenses, 18.9M SOL Cancelled: Hodler’s Digest

    August 31, 2026
    Get Informed

    Subscribe to Updates

    Get the latest creative news from FooBar about art, design and business.


    Facebook X (Twitter)
    • Home
    • About us
    • Contact Us
    • Privacy Policy
    • Terms & Conditions
    © 2026 altcoinvest.com

    Type above and press Enter to search. Press Esc to cancel.